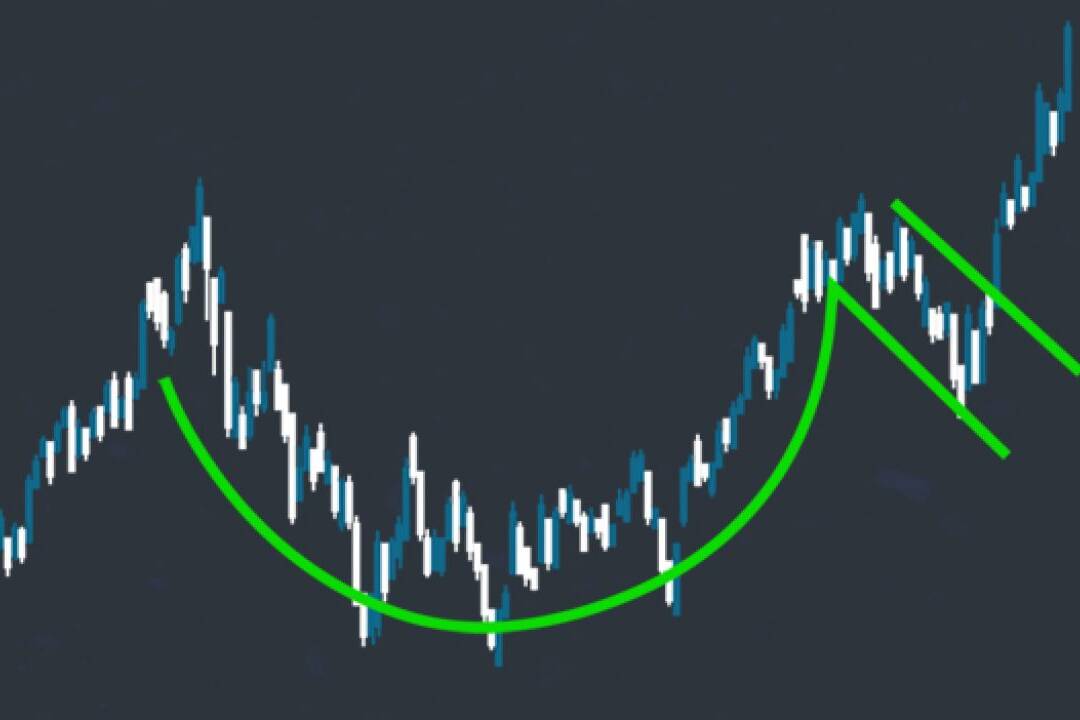
The SPY ETF is the oldest surviving and most widely known ETF that tracks the S&P 500 Index. The SPY is a well-diversified basket of stocks that allocates its fund into multiple sectors and is extremely popular among both day traders and hedge funds because it is so actively traded. The S&P 500 index is one of the most recognized stock market benchmarks in the world and SPY tracks it very well.
| SPY Annual Performance | |||||||||
|---|---|---|---|---|---|---|---|---|---|
| 2010 | 2011 | 2012 | 2013 | 2014 | 2015 | 2016 | 2017 | 2018 | 2019 |
| 15.06% | 1.89% | 15.99% | 32.31% | 13.46% | 1.25% | 12.00% | 21.70% | -4.56% | 31.22% |
The managers of the fund buy and sell certain stocks to align their holdings with the S&P 500 index. When you buy a share of SPY, you’re buying a unit of the current holdings, which represents a small portion of each stock on the S&P 500 index.
Investors buy SPY hoping that the holdings within the fund—the stocks of the S&P 500 index—will rise. This allows them to sell their SPY units at a higher price than what they paid. If the holdings within the fund fall, the value of each unit/share of SPY will fall as well.
| ETF | Expense Ratio | 10yr Performance |
| VOO | 0.03% | 8.26% |
| IVV | 0.04% | 11.90% |
| SPY | 0.09% | 11.85% |
Related Posts
May 5, 2023
Beginner Stock Trading Tactics for Post-Earnings Momentum
Earnings season is an exciting time for stock traders, as it can lead to…
March 30, 2023
Buying Earnings Winners in Structural Bases: The Cup-with-Handle Approach
Successful stock trading often involves identifying patterns that signal…
March 23, 2023
Demystifying Earnings Events: A Beginner’s Guide for Entry-Level Traders
Earnings events are significant market occurrences that can greatly impact a…


