Any longterm penny stock trader will attest to a stock’s ability to generate abnormal returns in the sub $20 niche, especially when an earnings catalyst is applied. This became apparent to me as I was introduced to the penny stock niche in mid-2012, and I immediately recognized the potential for exponential growth. I have mostly automated the process of locating and trading these stocks, and my Earnings Winner app caters to the strategy I derived from the lessons learned over the years.
Starting out, I learned from the prominent penny stock day-trader Tim Sykes, and I initially (and naively) assumed that he had invented the idea of buying earnings winners. Although this concept has been around for decades, Sykes blazed the trail in applying the strategy to lower priced stocks.
Ray J. Ball & P. Brown initially introduced a study in response to the market efficiency theory, and it has been widely studied in the finance industry ever since. You can further your research here, here, here, and here. The consensus is, that because of reasons, stocks tend to drift upwards over an extended period of time after a positive earnings announcement.
Most of what you’ll find out there is based on fundamentals, and tends to focus on a longer term time frame (only because they don’t know that they could be getting the same return in a fraction of the time if they’d buy lower priced stocks), but it’s always good to understand what other people are thinking, and what drives other traders into a stock.
Having learned from a technical trader, this is what I focus on.. so instead of watching for earnings surprises, I look for technical breakouts. Instead of looking at EPS, I look at short interest. This is a great recipe for both a short term squeeze, and a long term rise in price.
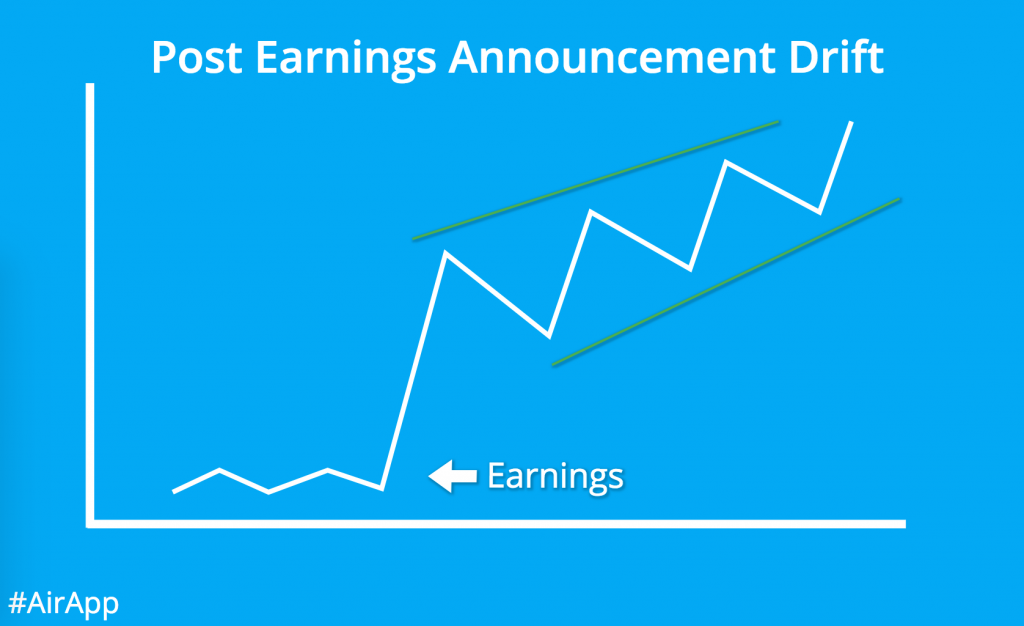
I have been trading the Post Earnings Announcement Drift (PEAD) chart pattern for a few years, and it’s my go-to strategy for growing my retirement account. This is a swing trading setup, which means you’ll want to hold for at least a few days, and maybe even a few weeks. I like to take a small position so my opportunity cost is low, and I always follow my buy orders with trailing-stops. Trailing stops allow me to maintain proper risk management while directing my focus and energy elsewhere.
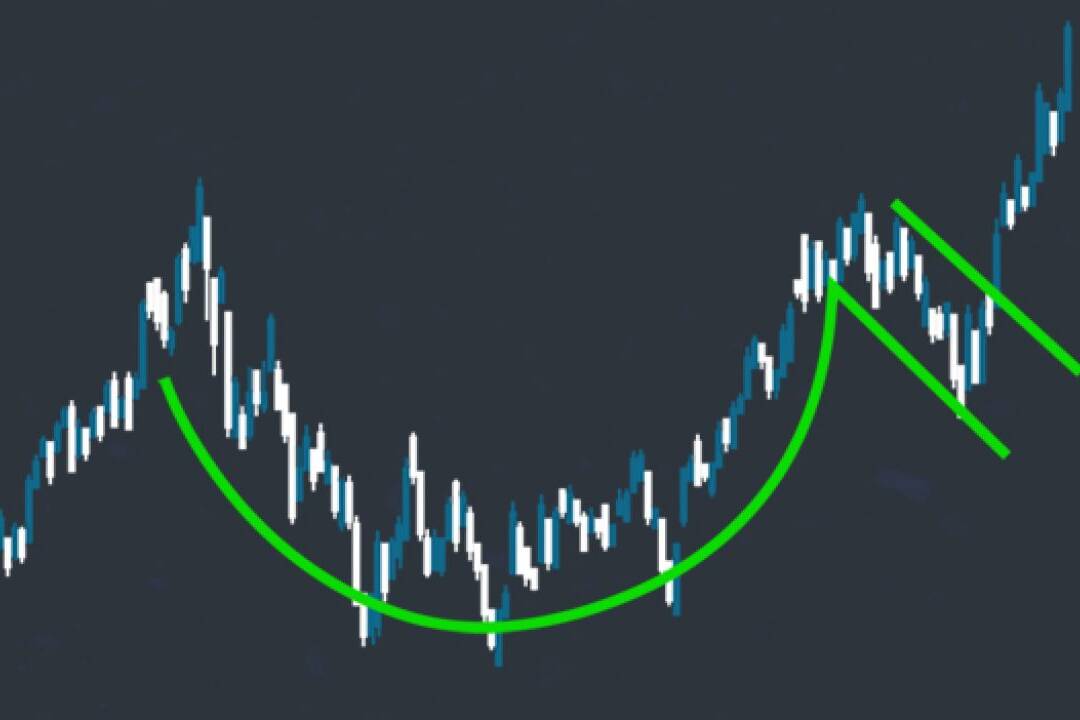
Here are a few examples of the PEAD chart pattern. We’re looking for a positive reaction to an earnings-related catalyst (quarterly report, record revenues/sales, etc), followed by a gradual increase in price over several days or weeks. Remember, the more you study charts of the past, the better you’ll be at recognizing a pattern forming in real time.
Related Posts
May 5, 2023
Beginner Stock Trading Tactics for Post-Earnings Momentum
Earnings season is an exciting time for stock traders, as it can lead to…
March 30, 2023
Buying Earnings Winners in Structural Bases: The Cup-with-Handle Approach
Successful stock trading often involves identifying patterns that signal…
March 23, 2023
Demystifying Earnings Events: A Beginner’s Guide for Entry-Level Traders
Earnings events are significant market occurrences that can greatly impact a…


Everything is very open with a really clear description of the challenges. It was definitely informative. Your website is extremely helpful. Thanks for sharing!
I’m pretty pleased to uncover this site. I need to to thank you for ones time for this particularly fantastic read!! I definitely liked every bit of it and i also have you book marked to look at new things on your web site.
Your content is excellent, this site could certainly be one of the very best in its field. Great blog!
Good day! This post couldn’t be written any better! Reading this post reminds me of my previous room mate! He always kept chatting about this. I will forward this write-up to him. Fairly certain he will have a good read. Many thanks for sharing!
This is a topic which is near to my heart… Thank you!
Excellent weblog right here! Additionally your site is very fast! I want my website loaded up as fast as yours lol
You seem to have a lot of confidence in the things you do. Nice post also! Keep it up!
[…] charts remind me of the post earnings announcement drift strategy I wrote about a few years […]
[…] decisions to buy, hold, or sell aren’t influenced by any kind of ratio or acronym (unless it’s PEAD). I let the price action guide the way instead. This may not sound rational at first, but the more […]
bookmarked!!, I love your website!
wow… what a great blog, this writter who wrote this article it’s realy a great blogger, this article so inspiring me to be a better person