

What is Pattern Recognition?
Pattern recognition is critical in developing an edge in the stock market, and just like anything else in this discipline, it must be an extension of your personality and skill sets.
For example, I am a visual person so I excel at discovering patterns in stock charts, and that helps to define my strategies. For you, it could be extracting meaningful patterns from raw order flow or noticing trends within financial statements. Either way, it all comes down to the ability to notice trends that lead to predictable price movements.
Using Patterns to Build Strategies
All of my strategies stem from a single pattern:
Quarter after quarter, earnings announcements lead to volatile price action, creating a rich environment for profit.
This one pattern is the foundation of every one of my strategies and it allows me to dramatically narrow my trading universe.
Once I establish a base pattern (something that is easily recognizable and repeatable) I start looking for trends in price action. Generally speaking, there are three things I like to ask myself when approaching a new strategy:
- Using the earnings event as a catalyst, do stocks generally go up or down post-earnings? If there is ample opportunity on both sides, great! I can separate them into potential long and short strategies.
- How can I capture the largest move? If I’m looking to build a day trading strategy I’ll look for candles with large bodies and big single-day moves (I like to use % Change from Open), then look for commonalities between all the charts so I can learn to recognize them in real-time.
- What would my entry point be? are there any technical chart patterns (flags, triangles, etc)? do the biggest moves happen after a technical breakout or breakdown?
As you can see, my focus narrows with every trend I uncover, and high probability trading setups begin to reveal themselves.
Discovering patterns in price action is an effort that never ends; a puzzle that one may never solve. The ever-changing nature of the market forces the long-term trader to live in a reality of continuous development, progress, and growth.
Example
This is a list of all the stocks I’m working on right now.. looking for patterns to build strategies around.
It’s my “Power Earnings Gap” list from Q2 2019.. earnings gap ups that close near their day high. My theory is that these create the most volatility post-earnings, given the wide price range produced by the strong gap up & close.
I’m looking for post-earnings patterns.. do most of these tend to continue moving up or do they reverse? If so, what’s the inflection point and how many days after the earnings announcement did this occur? From my experience, most of the big upward moves follow a breakout over the earnings day high, and the opposite is true for downtrends.
I like whole/half dollar levels for my entries, so I’ll typically round the earnings day high to the nearest dollar.

This is a daily chart of ENPH (from the list above). That breakout day had 7% of upside, so there was a good opportunity for a day trade. The breakout also produced some up-side momentum for a longer-term trade (I define long term as a week or two).
At this point, we have a strategy we can take action on. We can use a screener to locate stocks that announced earnings today, gapped up, and closed near the highs. Then we can set an alert at the day high or nearest whole/half dollar, and wait for it to trigger. Once the alert triggers, we send our buy order in and hopefully get a position.
So how did pattern recognition help me build this strategy?
- Volatility tends to follow an earnings announcement.
- Big gap ups produce wide price ranges (wider price ranges = more profit potential).
- Breakouts over the earnings day high generate momentum, propelling the stock to much higher prices.
This goes against the traditional “buy low, sell high” philosophy because we are buying high and selling higher. Strong momentum allows us to do that.
Here’s a chart illustrating the inverse. A post-earnings continuation breakdown:

Practice
For me, learning to see patterns in price action began with charts. I started noticing certain trends in price following an earnings announcement, then saved, categorized, and studied these charts so I could quickly recognize their development in real-time.
There are a ton of free resources on the internet that detail the ins and outs of charting and technical analysis. Here are a few:
1. Google image search for technical analysis. This query returns a lot of chart pattern compilation images that highlight the most popular chart patterns, including flags, pennants, and wedges.
2. Investors Underground Day Trading Encyclopedia. There is a lot of good information in here, but for the purpose of building pattern recognition, check out the Charts and Stock Chart Patterns sections.
3. Earnings winner chart patterns. I told you I saved and categorized a bunch of charts, so here are a few collections worth studying. See if you can identify the characteristics of each pattern to determine why each chart landed in the category it did. Post Earnings Drift. Range Breakouts. Ascending Triangle Breakouts.
Related Posts

Beginner Stock Trading Tactics for Post-Earnings Momentum
Earnings season is an exciting time for stock traders, as it can lead to…
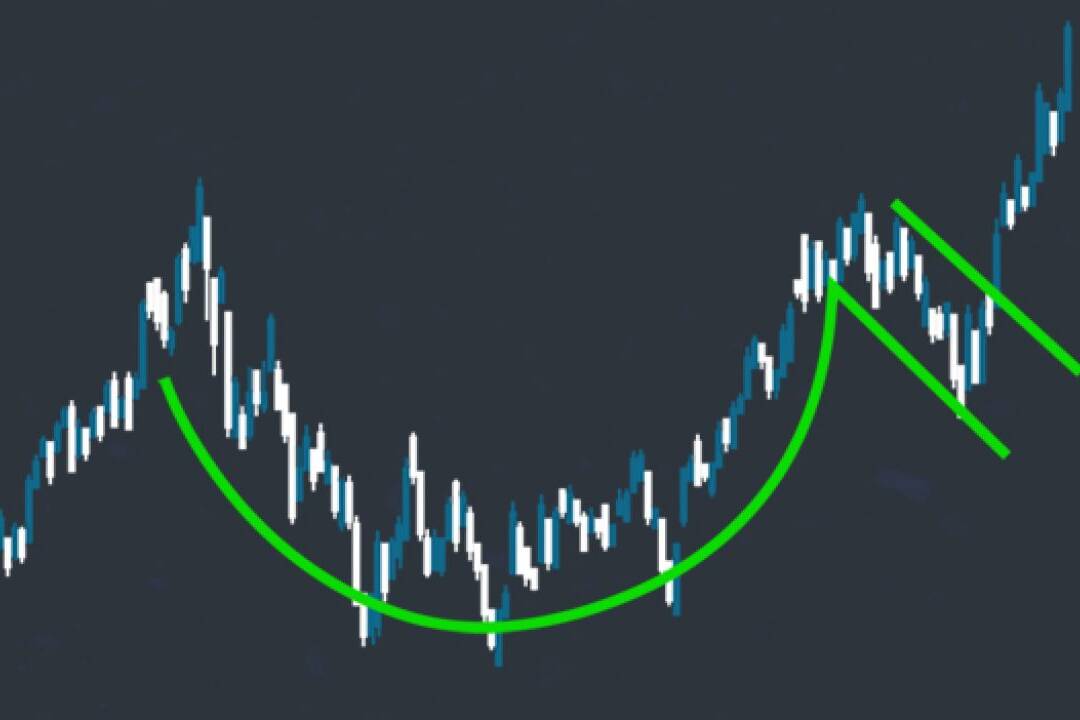
Buying Earnings Winners in Structural Bases: The Cup-with-Handle Approach
Successful stock trading often involves identifying patterns that signal…
Demystifying Earnings Events: A Beginner’s Guide for Entry-Level Traders
Earnings events are significant market occurrences that can greatly impact a…