

Historically, most of my success has come from trading on the long side.
Up until 2018, we were in a bullish continuation market, so buying earnings-driven continuation breakouts made sense to me.
Now that I have access to a dedicated earnings scanner, I realize that there is a ton of opportunity for shorting.
Here’s a strategy I’ve been feeding into my automated trading platform recently that has made some serious money.

You can see the equity curve (account balance) starting at $40k and rocketing up to nearly $60k after only 48 trades.
It’s pretty simple and is basically the inverse of my post-earnings continuation strategy on the long side.
Locate stocks that are down more than 10% from the earnings day open, short as they cross below support, and hold for a few days.
More specifically, this strategy will either hold for 5 days or take profits at 15%. This is what the equity curve looks like in the Q2 backtest.
And a few more performance metrics about the strategy:

And a few position-management details:

I got a recent trade on $OPTN, so let’s use that chart as an example of what the pattern looks like.

Here is a link to the screener I’ve been using to locate these stocks: https://earningswinner.io/screener/DSeQFvskdF9IvnmsQNVJ
Related Posts

Beginner Stock Trading Tactics for Post-Earnings Momentum
Earnings season is an exciting time for stock traders, as it can lead to…
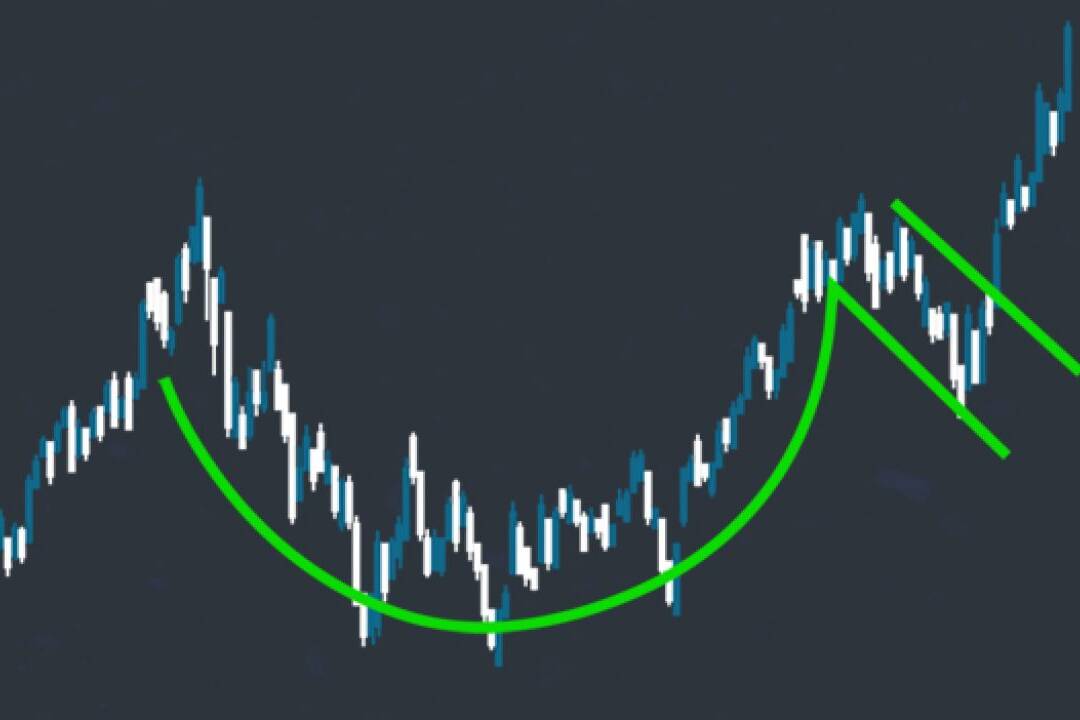
Buying Earnings Winners in Structural Bases: The Cup-with-Handle Approach
Successful stock trading often involves identifying patterns that signal…

Demystifying Earnings Events: A Beginner’s Guide for Entry-Level Traders
Earnings events are significant market occurrences that can greatly impact a…