

Related Posts

Beginner Stock Trading Tactics for Post-Earnings Momentum
Earnings season is an exciting time for stock traders, as it can lead to…
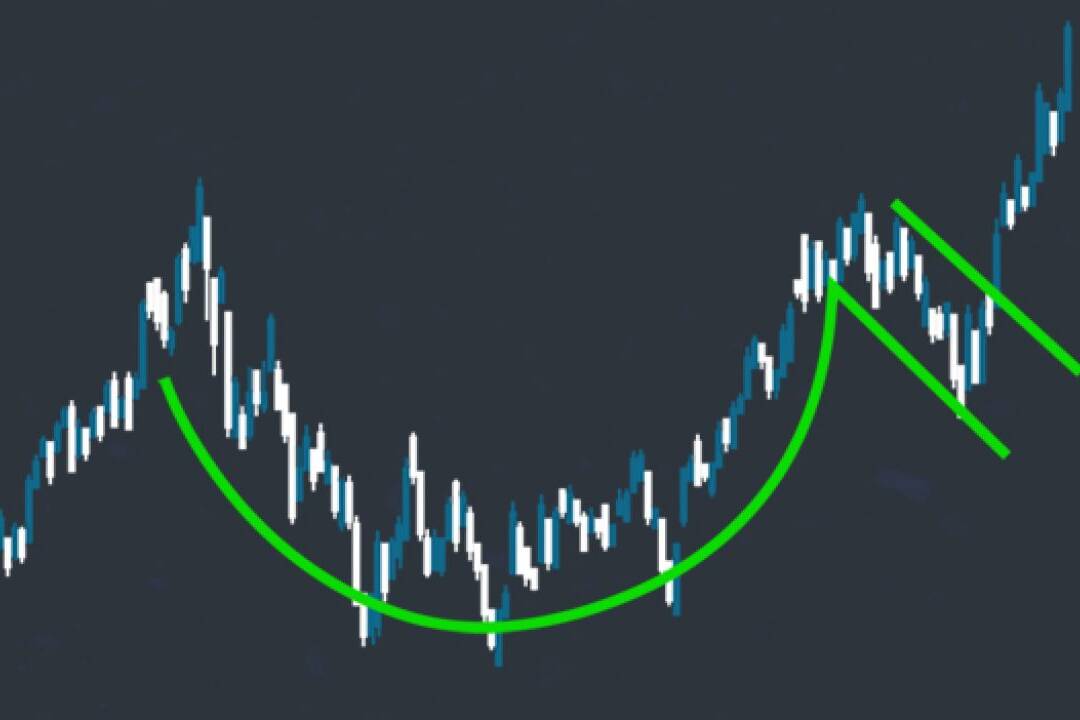
Buying Earnings Winners in Structural Bases: The Cup-with-Handle Approach
Successful stock trading often involves identifying patterns that signal…

Demystifying Earnings Events: A Beginner’s Guide for Entry-Level Traders
Earnings events are significant market occurrences that can greatly impact a…