

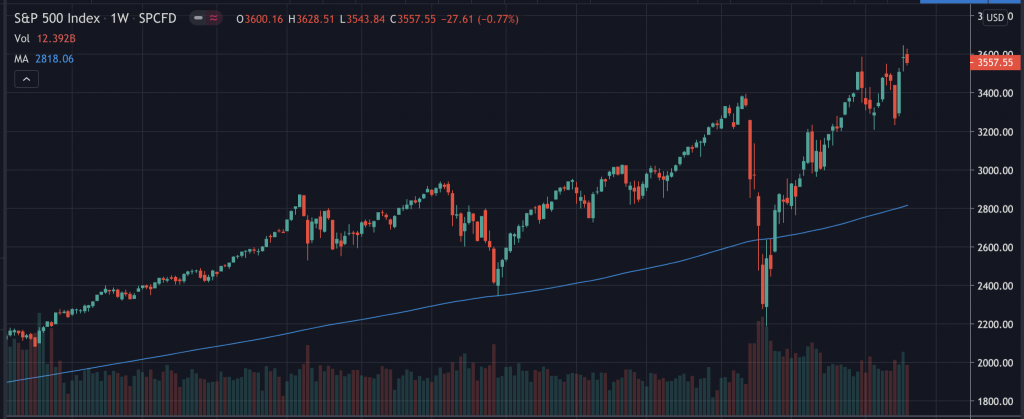
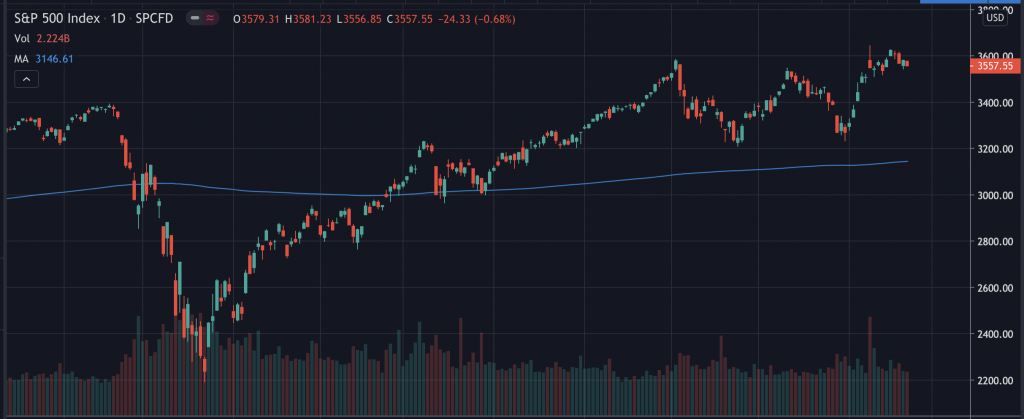
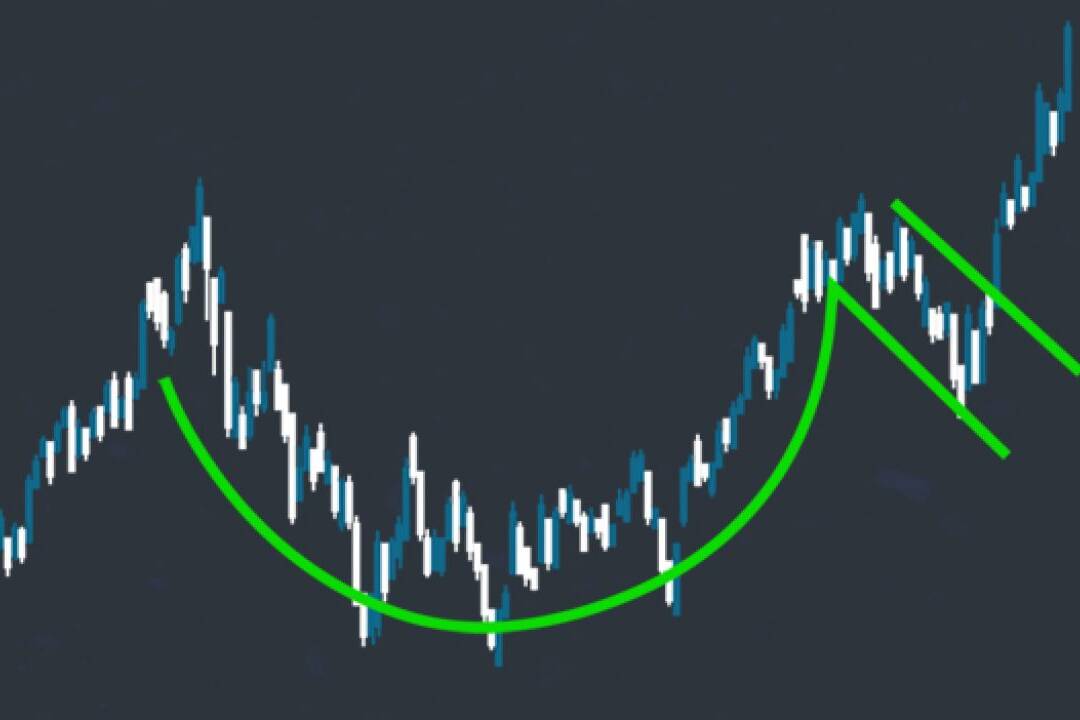
Despite closing red on the week, SPX continues to pull away from the 200 day moving average. The weekly chart put in an “inside” candle [more info on the inside day pattern here] this week, indicating potential continuation. Basing around all-time highs, the daily chart is coming out of a W bottom formation and is currently holding above the breakout level. This is definitely not bearish.
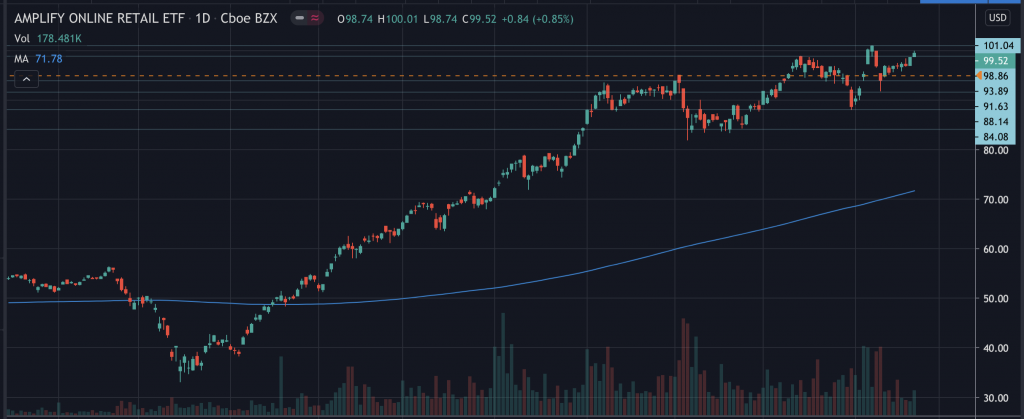
- IBUY has been on fire since COVID and is now looking for new all-time highs.
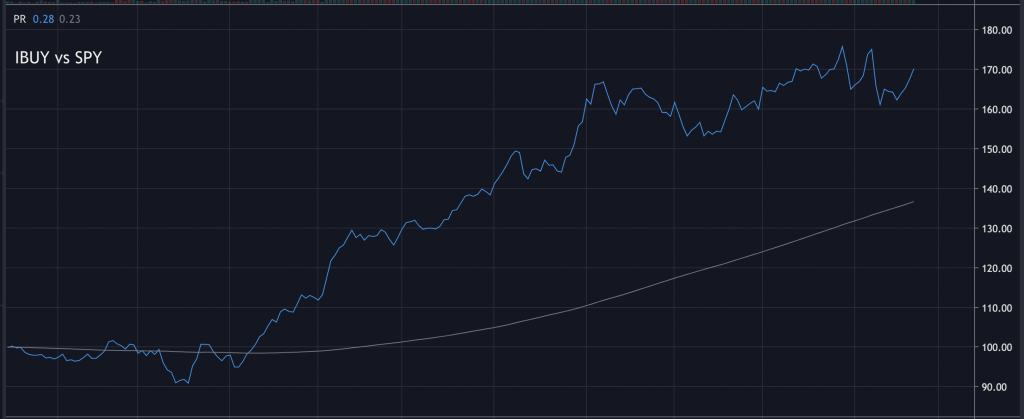
- Internet retail continues to outperform SPY on a relative basis.
[get my price relative chart on TradingView]
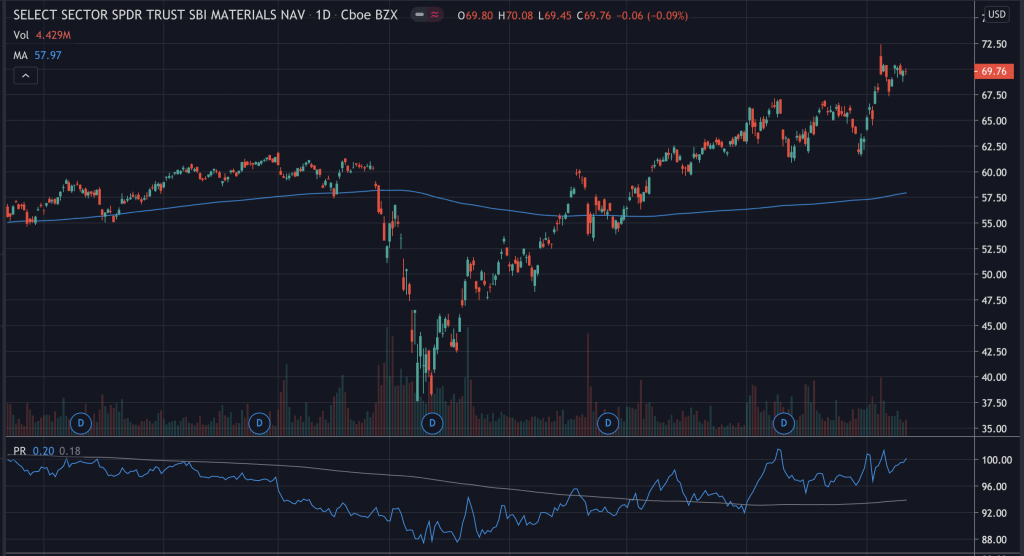
- XLB materials coiling on the daily chart
- Trading %10+ above pre-covid highs
- Outperforming SPY on a relative basis since COVID lows
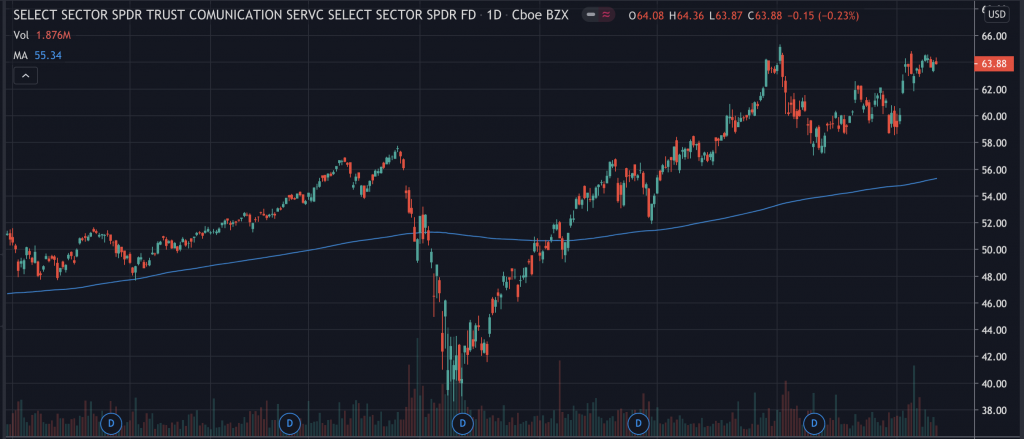
- XLC communications is trading +10% above pre-covid highs
- Pulled back and is now rebounding near all-time highs
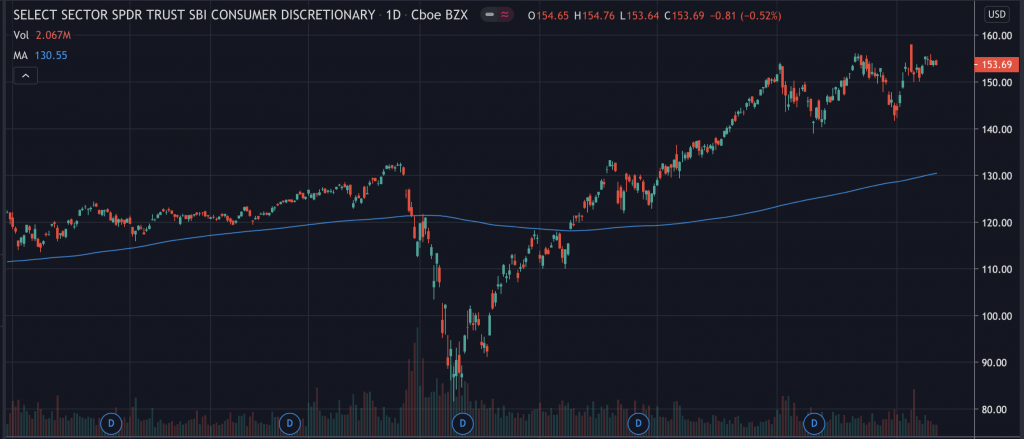
- XLY consumer discretionary trading +15% above pre-covid highs
- “W” bottom pattern on the daily chart with higher lows
- Nearing all-time highs
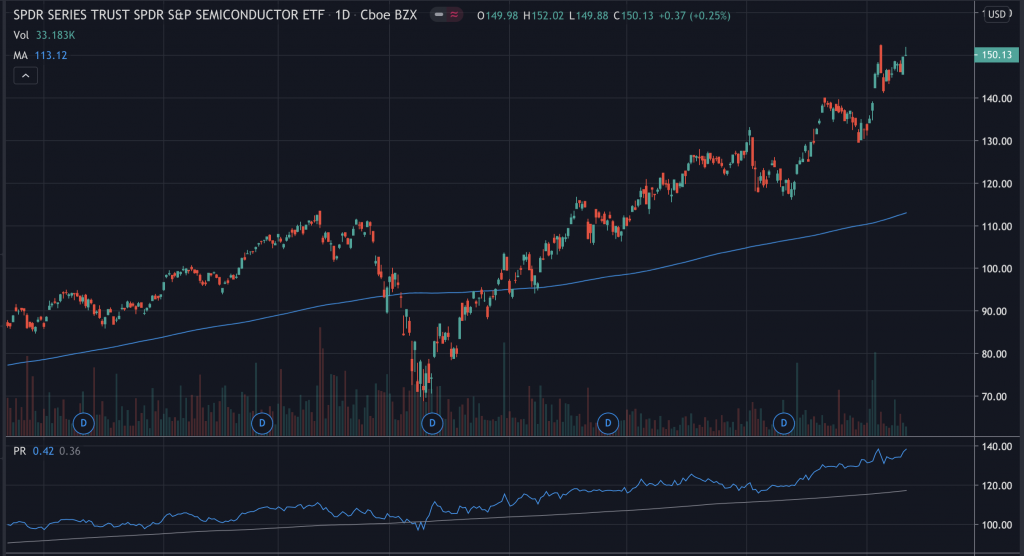
- XSD semiconductors trading +30% above pre-covid highs
- Testing all-time highs in a strong uptrend
- Steadily outperforming SPY since Jan 2019
Related Posts

Beginner Stock Trading Tactics for Post-Earnings Momentum
Earnings season is an exciting time for stock traders, as it can lead to…
Buying Earnings Winners in Structural Bases: The Cup-with-Handle Approach
Successful stock trading often involves identifying patterns that signal…

Demystifying Earnings Events: A Beginner’s Guide for Entry-Level Traders
Earnings events are significant market occurrences that can greatly impact a…
I got what you intend,bookmarked, very decent website.
I reckon something truly special in this website.
Really appreciate you sharing this blog.Thanks Again. Great.