

Image courtesy Jan Kruger/Stringer/Getty
Markets Today
What a way to end the first half of one of the wildest years in market history. Investors decided to go shopping, and they bought nearly every sector of the U.S. stock market, with all indexes closing in the green. Typically, the last day of the quarter brings heavy volatility with it as portfolio managers rebalance—especially after massive gains. If they rebalanced today, they did so by adding stocks.
Here’s how the quarter sums up for U.S. markets:
- DJIA: +17.8%, best quarter since 1987
- S&P 500: +20%, best quarter since 1988
- Nasdaq: +30.6%, best quarter since 1999
Granted, all these indexes are coming off a low base, having plunged 35% or more from February to March, but the ascent has been swift and record setting.
Uncertainty will be the overarching theme of the third quarter as the virus is still very much a factor in all of our lives. Regulators and central banks have spent trillions to stem the crisis, but more will be needed, in addition to a healthy dose of common sense. The recovery will be uneven, unpredictable, and unsettling, but we will march on.
As for what happens to markets going forward, nobody really knows. There are plenty of predictions, and we cite a lot of them. We do know what happens historically after huge quarters like the one we just closed. But this year is full of surprises, so don’t count on history to be your guide.

chart courtesy LPLFinancial
Headlines:
- U.S. consumer confidence in June posted its biggest monthly gain in nine years as optimism increased amid business re-openings, though sentiment remained well below pre-pandemic levels. The Conference Board’s index jumped by 12.2 points to 98.1, the biggest one-month gain since late 2011, according to a report Tuesday.
- European Union governments extended a travel ban for U.S. residents for two weeks, citing an insufficient American response to the coronavirus pandemic. The EU will lift travel restrictions for Chinese residents as of July 1, on the condition that Beijing confirms that the same applies to EU citizens.
- Oil giant Royal Dutch Shell expects a post-tax impairment charge (write down value of assets) of up to $22 billion in the second quarter. It predicts Brent crude oil prices at $35/bbl in 2020, $40/bbl in 2021, $50/bbl in 2022, and revised the average long-term refining margins downwards by around 30%.
- Amazon Web Services, the cloud-computing branch of the e-commerce giant, is further expanding its services in the growing space industry. The company announced on Tuesday that AWS is establishing a new unit called Aerospace and Satellite Solutions, led by a former U.S. Air Force Major General who most recently directed the establishment of the U.S. Space Force.
- The latest survey of business leaders by The Business Roundtable reveals that most expect business conditions to recover by the end of 2021, but 27% say it will take longer than that. Plans to expand hiring and capital expenditures decreased by more than one-third as companies tighten their belts amid the pandemic.
- China’s official manufacturing PMI came in at 50.9 in June, up from 50.6 in May, indicating the fourth straight month of expansion. It plunged to 35.7 in February. Industrial profits rose 6% in May year-over-year, the first increase since Nov. 2019. They are down 19.3% for the first five months of 2020.

chart courtesy Goldman Sachs
The Equity Risk Premium for Stocks
In our latest installment of “Why stocks keep going up despite everything…” series, we are looking at the equity risk premium for stocks. The ERP (the pros call it that) refers to the excess return that investing in the stock market provides over a risk-free rate. The 10-year U.S. Treasury yield is the most commonly used security against which equity risk is measured.
Institutional money managers, and some individuals, use the ERP to determine whether investing in stocks fits into their risk profile. Given that the yield on the 10-year U.S. Treasury is between 0.6–0.8%, which is historically low given the Fed’s commitment to low interest rates through 2021, the ERP for stocks, as seen through the S&P 500, according to Goldman Sachs, is high but reasonable. For investors seeking yield, meet T.I.N.A. (There is no alternative). The risk in owning stocks is high, but given that rates aren’t moving anytime soon, the premium for owning them may be worth it to investors, which could power stocks higher.

chart courtesy YCharts
First Half Scorecards
Business journalists like to keep score, so since we are at the halfway mark of the year, we will indulge.
Looking around the world, the countries with the strongest performance continue to be China and the U.S. China has the only positive returns for the year, as seen through the MSCI country indexes. It was the first into and out of the pandemic, and its recovery seems to be proceeding well. Australia and Canada, which are both heavy industrial, energy, and mining-based economies, are seeing a slower recovery given the economic damage in those sectors. Latin America is in bad shape, as COVID-19 ravages Brazil, and the drop in exports and tourism punishes the continent.

Strongest U.S. Stock Sectors
I had to look twice at this breakdown, courtesy of YCharts, because I couldn’t believe Consumer Discretionary was the best performing sector in the first half of the year. It contains restaurants, hotels, clothing retailers, and other devastated categories in 2020. But it also contains Internet commerce companies like Amazon (AMZN) and eBay (EBAY). Mystery solved.
The Communications sector was the second best performing sector, thank you Alphabet (GOOG) and Facebook (FB). The worst performing sector of the strongest was Industrials. That will rebound if and when economies recover with more fortitude. Energy, obviously, didn’t make the top eight. Returns for that index are down 54% this year.

Strongest U.S. Stocks
The top three U.S. performing stocks of the S&P 500 were probably not on anyone’s top picks list for the year back in January.
- Carrier Global (CARR), the Florida-based air conditioner and refrigerator manufacturer, is having its best year as a public company. It was spun off from UTC earlier this year, and shares have been climbing since then.
- DexCom Inc. (DXCM) makes a glucose monitoring sensor and software for diabetics. It’s an important product for a critical medical issue, but it has not been the focus of our health fears, lately.
- Regeneron (REGN) is working on a COVID-19 antibody, like a lot of pharma companies are these days. It’s been the subject of bad headlines lately given recent remarks by its CEO, so we’ll see if this performance lasts.

Weakest U.S. Stocks
You didn’t have to look far outside of the energy, cruise ship, and airline industries to find the worst performing stocks of the year. There’s some retailers in there, as well, and Xerox (XRX), which has unfortunately lost its way in the 21st century. I wasn’t familiar with TechnipFMC (FTI), but it turns out that it’s an energy company with a really confusing name.
(chart courtesy YCHARTS)

Shares of Citizens Financial Group are up by over 7% following the bank’s announcement that it plans to maintain its current dividend level through the third quarter of 2021. Xilinx’s stock price rose by over 6.5% after the integrated circuits manufacturer raised its Q1 quarter revenue guidance.

Shares of Boeing are down by 6% following Norwegian Air canceling an order of nearly 100 jets from the plane manufacturer. Coty’s stock price fell by over 5.5% amid Seed Beauty, manufacturer for Kylie Cosmetics, filing a suit against the beauty company for allegedly accepting trade secrets.
Word of the Day
Rebalancing
Rebalancing is the process of realigning the weightings of a portfolio of assets. Rebalancing involves periodically buying or selling assets in a portfolio to maintain an original or desired level of asset allocation or risk. For example, say an original target asset allocation was 50% stocks and 50% bonds. If the stocks performed well during the period, it could have increased the stock weighting of the portfolio to 70%. The investor may then decide to sell some stocks and buy bonds to get the portfolio back to the original target allocation of 50/50.

image courtesy Yale.edu
Related Posts

Beginner Stock Trading Tactics for Post-Earnings Momentum
Earnings season is an exciting time for stock traders, as it can lead to…
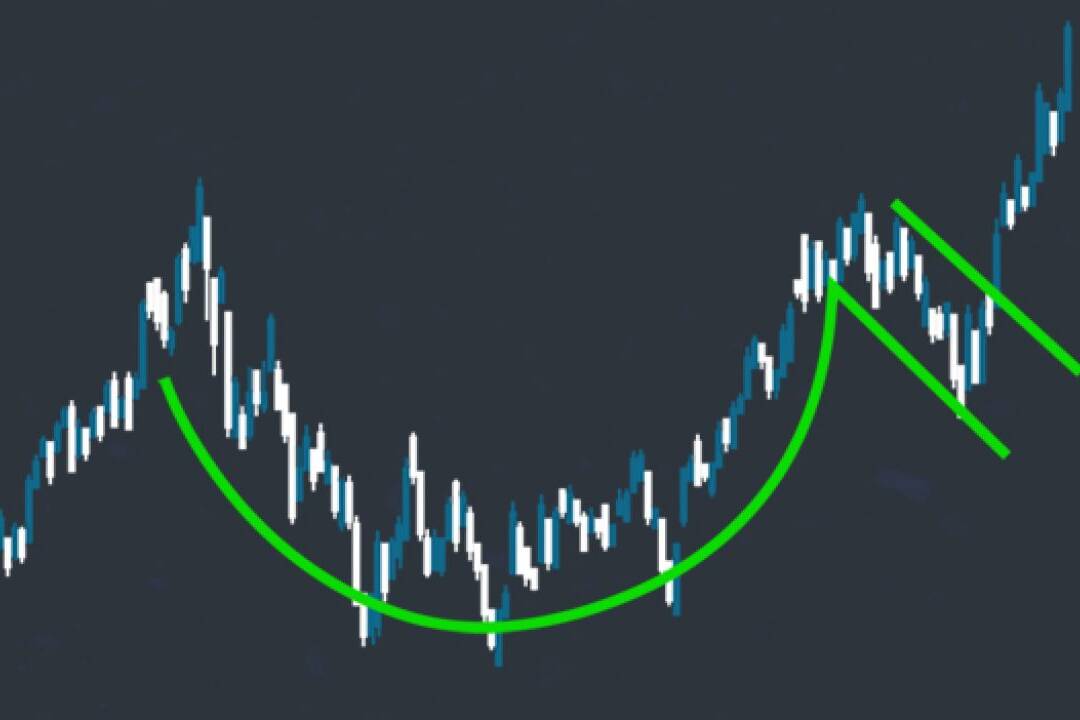
Buying Earnings Winners in Structural Bases: The Cup-with-Handle Approach
Successful stock trading often involves identifying patterns that signal…
Demystifying Earnings Events: A Beginner’s Guide for Entry-Level Traders
Earnings events are significant market occurrences that can greatly impact a…