

If your definition of an earnings winner is driven by analyst estimates, then you may be surprised that one of the most bullish indicators for earnings winners is of technical nature.
I judge an earnings win by the reaction, not some arbitrary number a random analyst estimated as significant.
My decisions to buy, hold, or sell aren’t influenced by any kind of ratio or acronym (unless it’s PEAD). I let the price action guide the way instead. This may not sound rational at first, but the more you play these low priced earnings winners, you’ll learn that the words “irrational” and “opportunity” often go hand-in-hand.
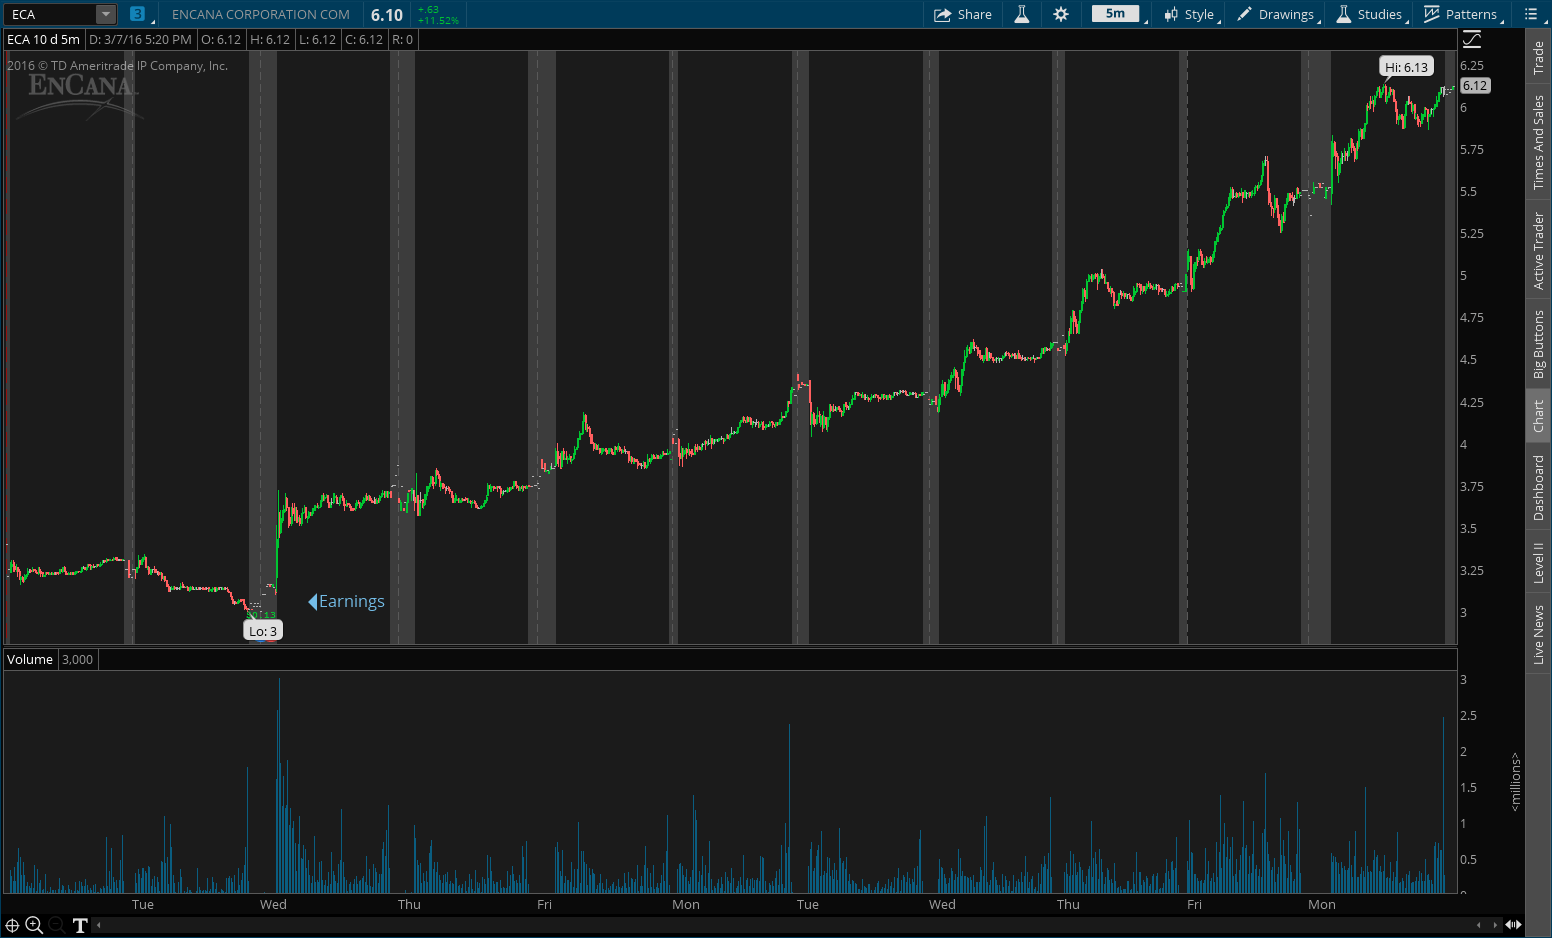
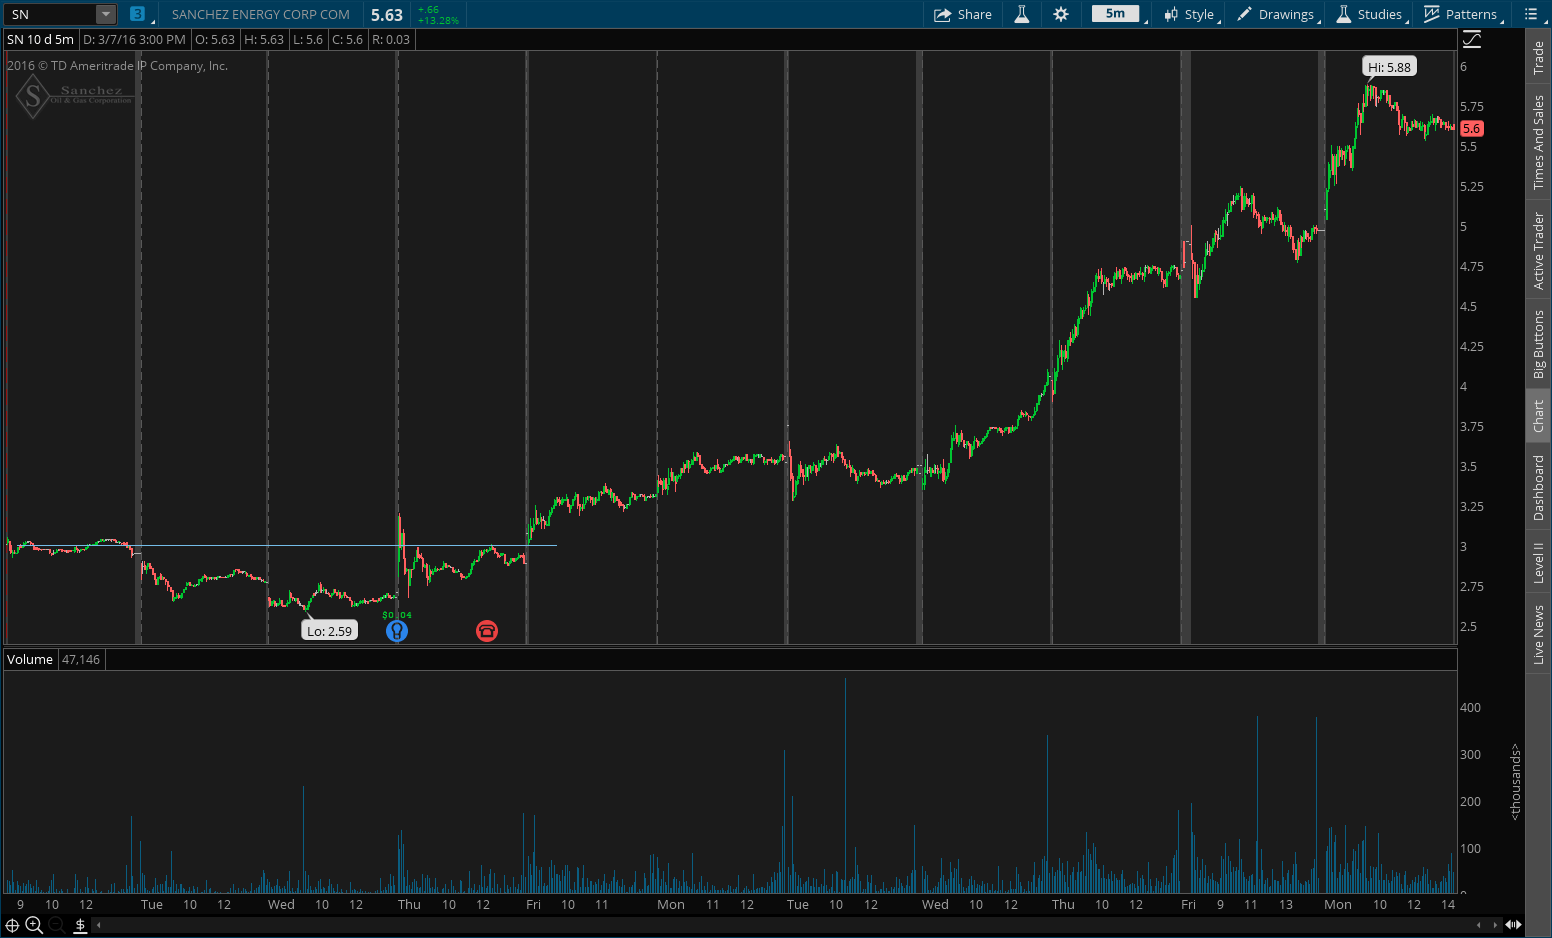
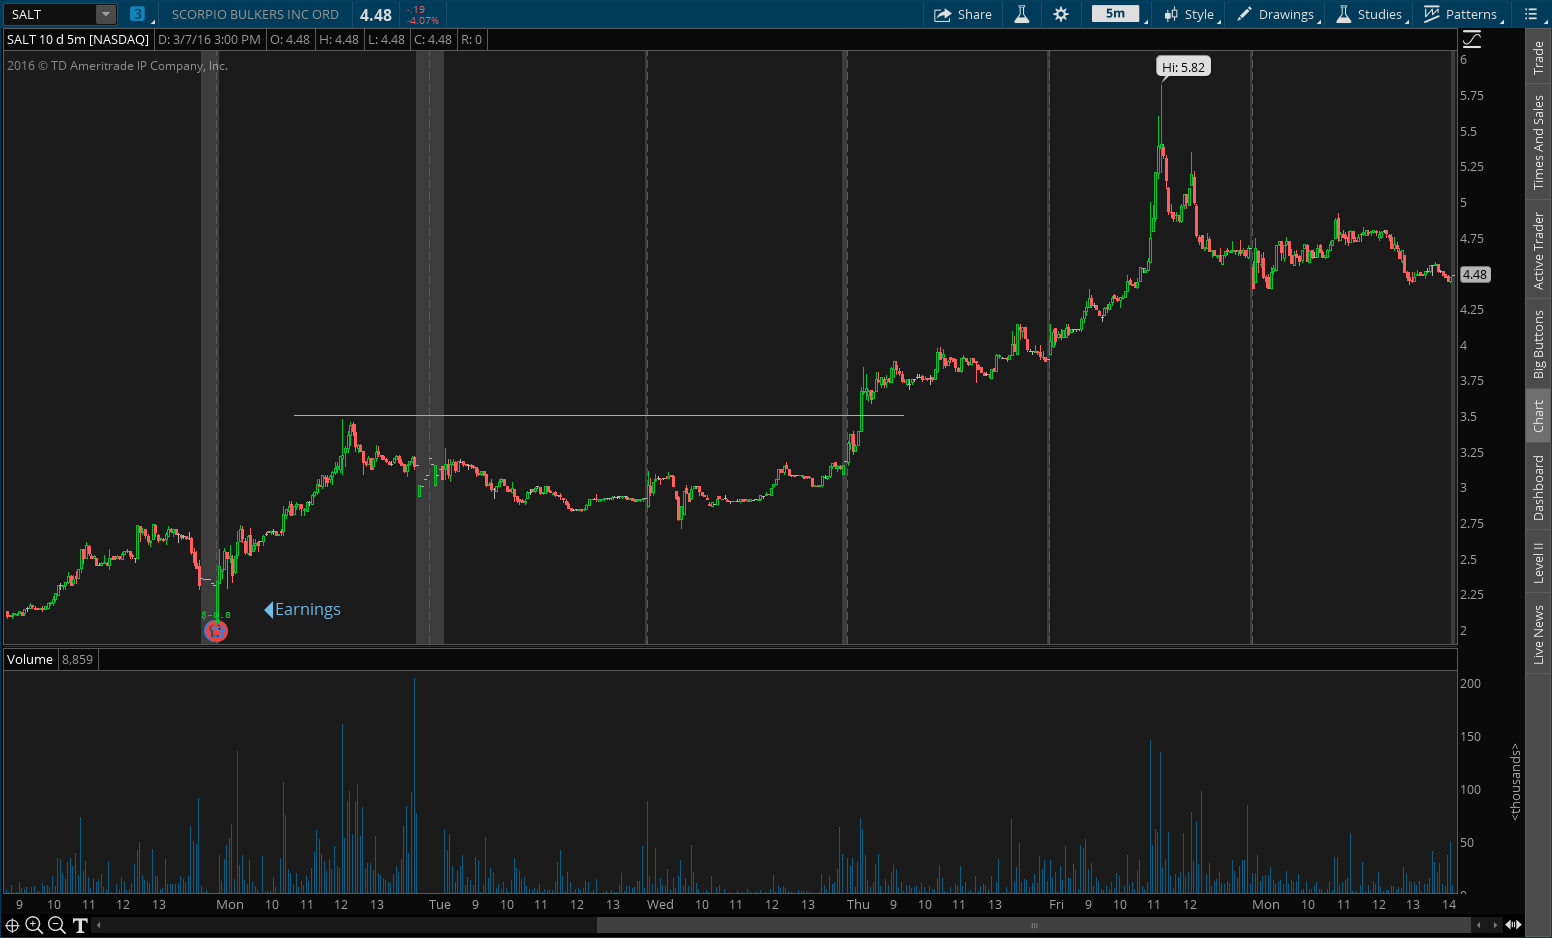
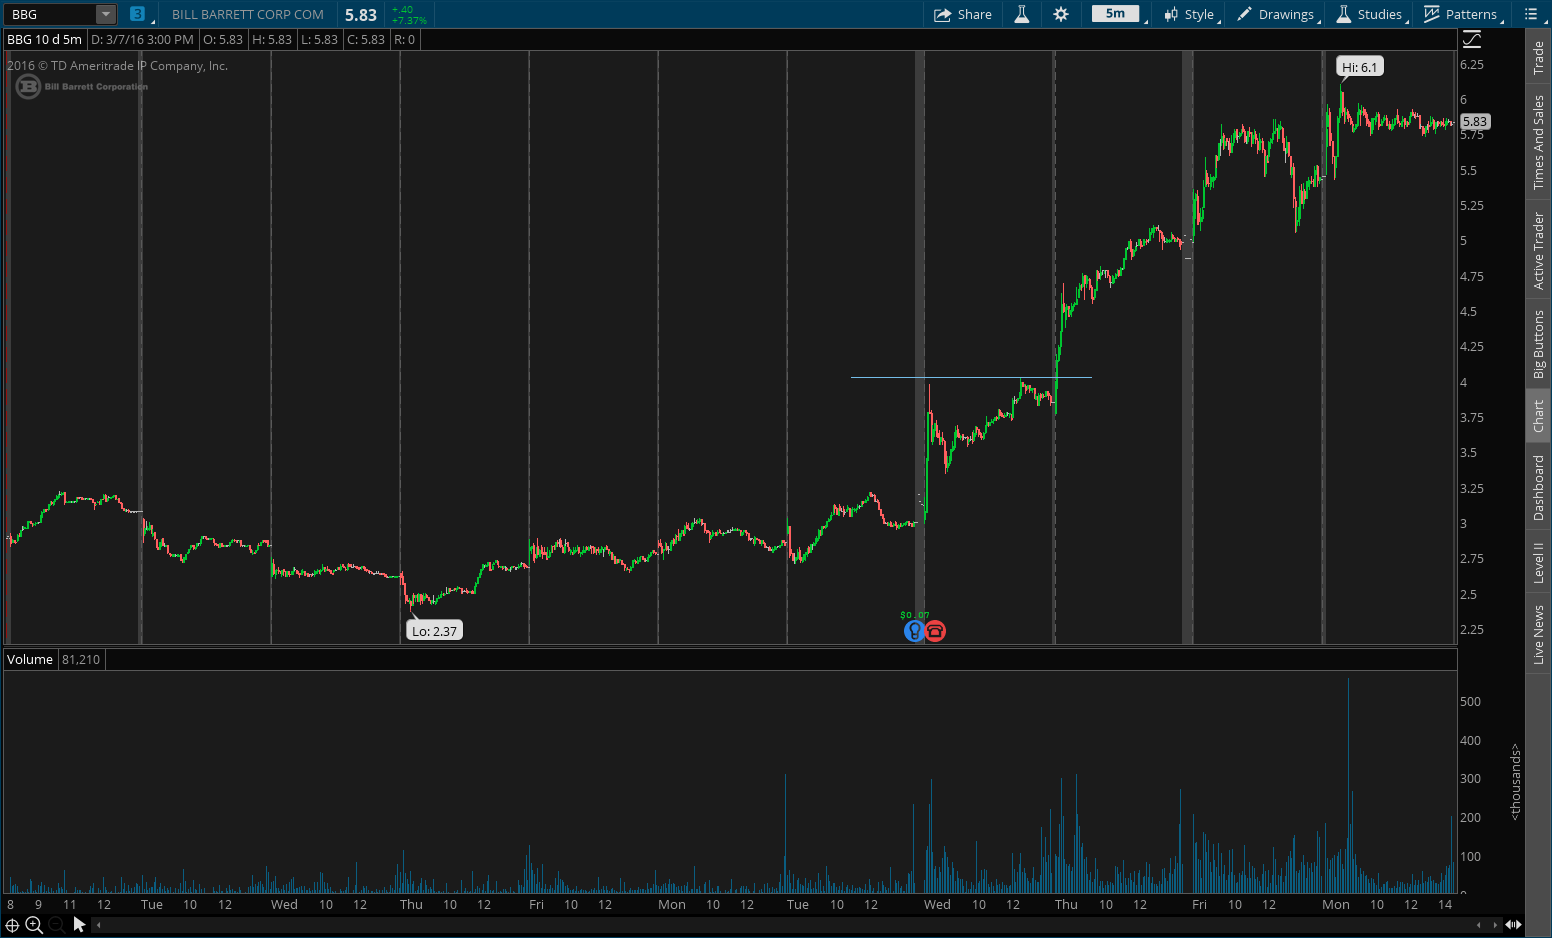
I’ve been tracking this indicator for about 2 years, and shared a few chart examples back in Q3 2015. Most of those charts are short term, but I’ve noticed that a breakout over the day 1 high can lead to some significant follow-through.
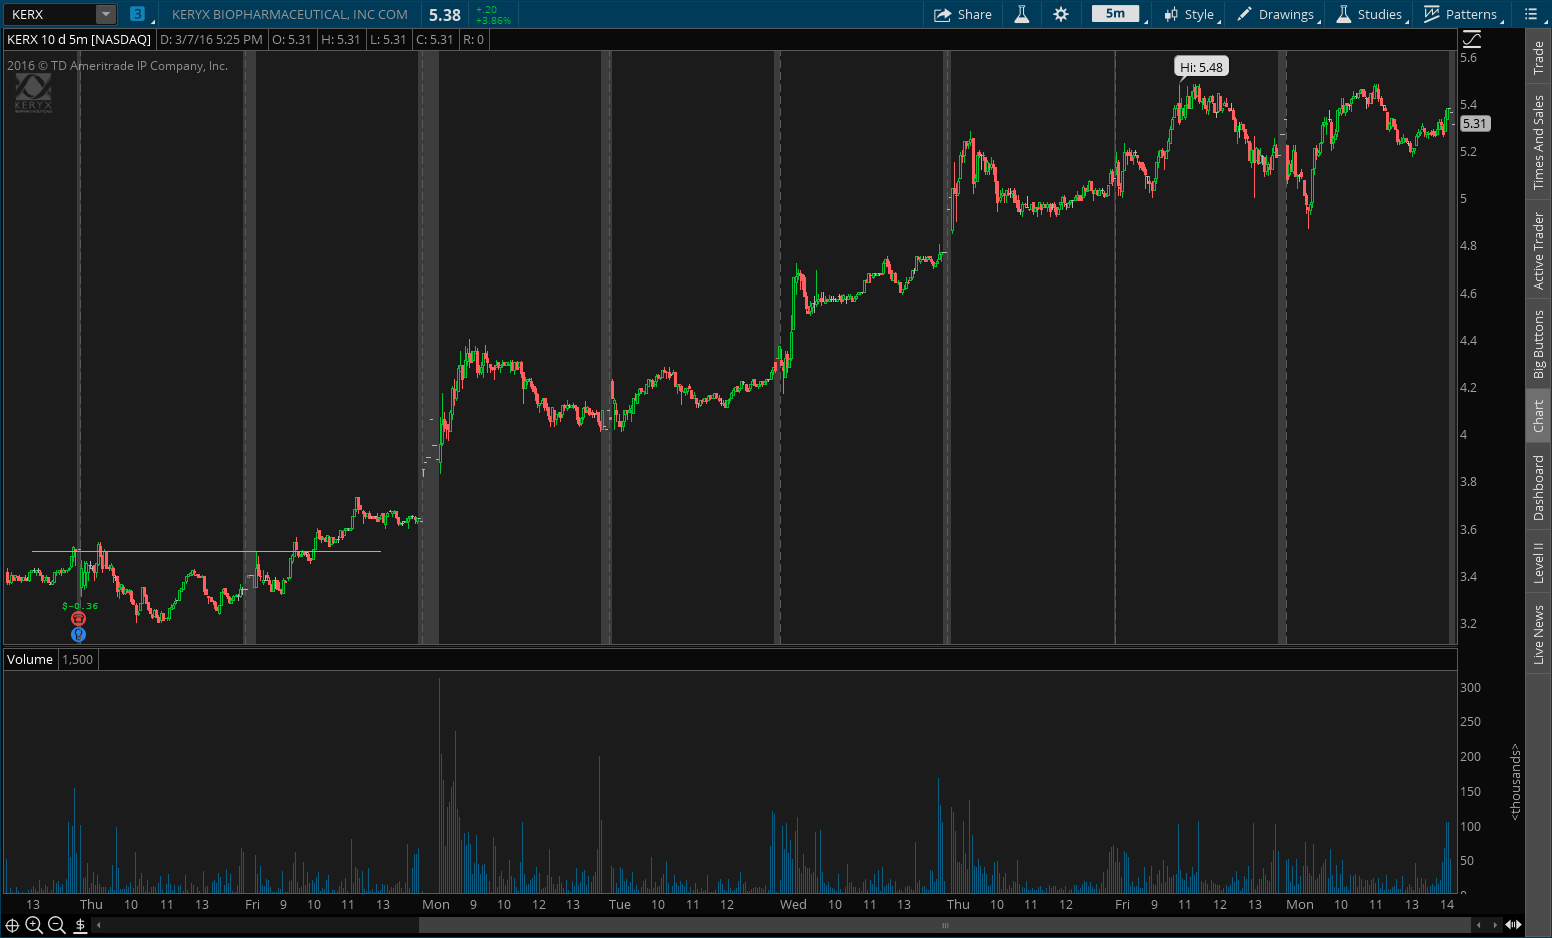
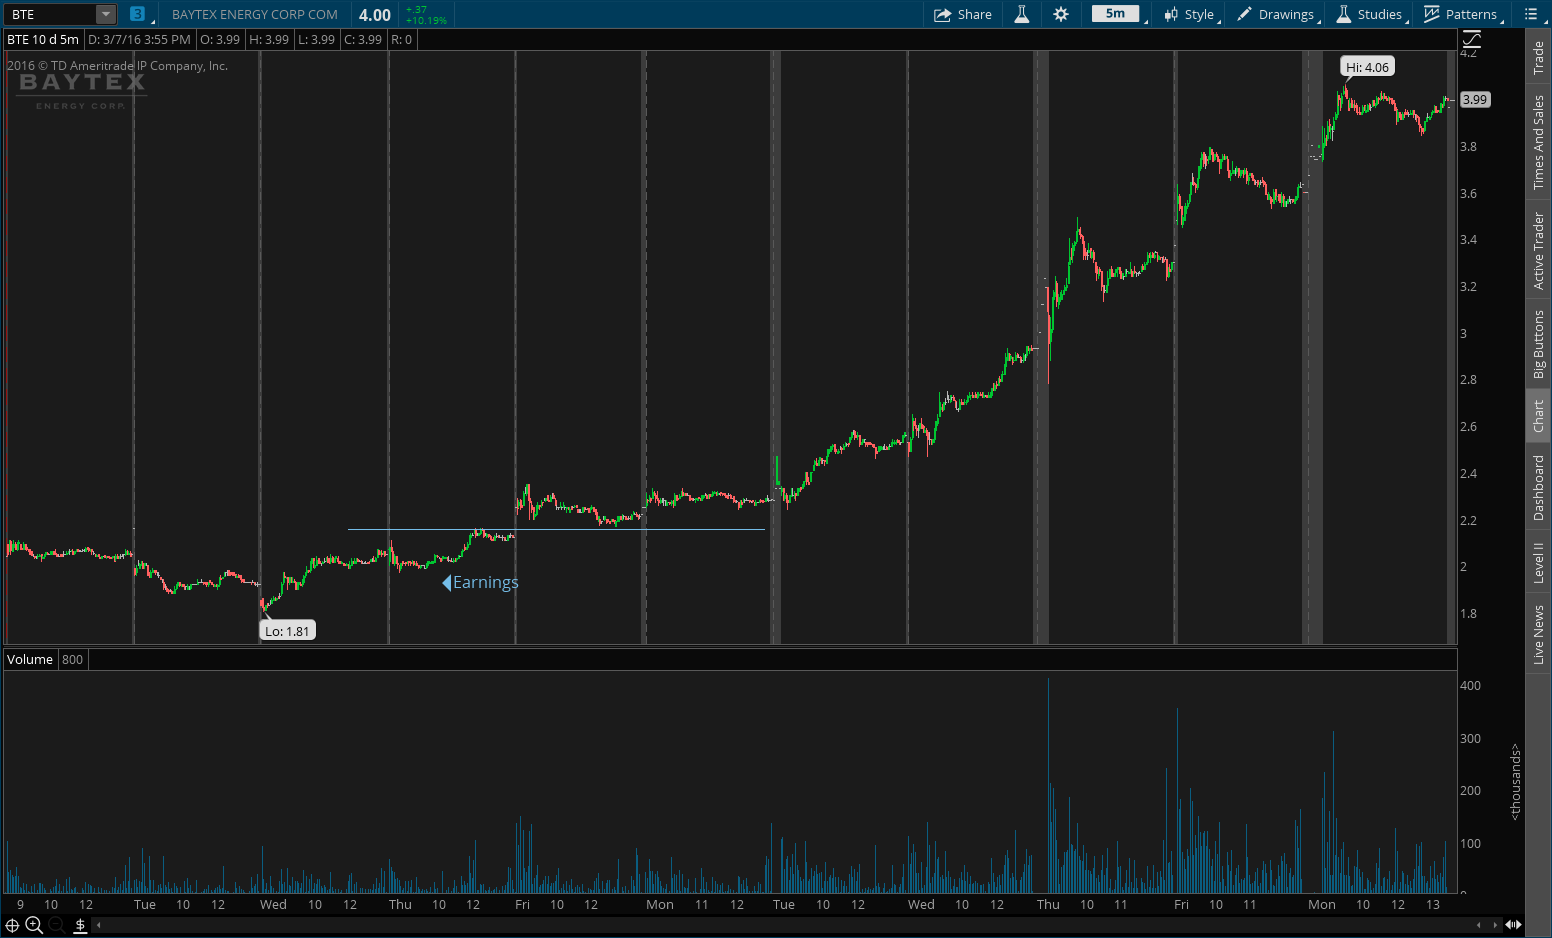
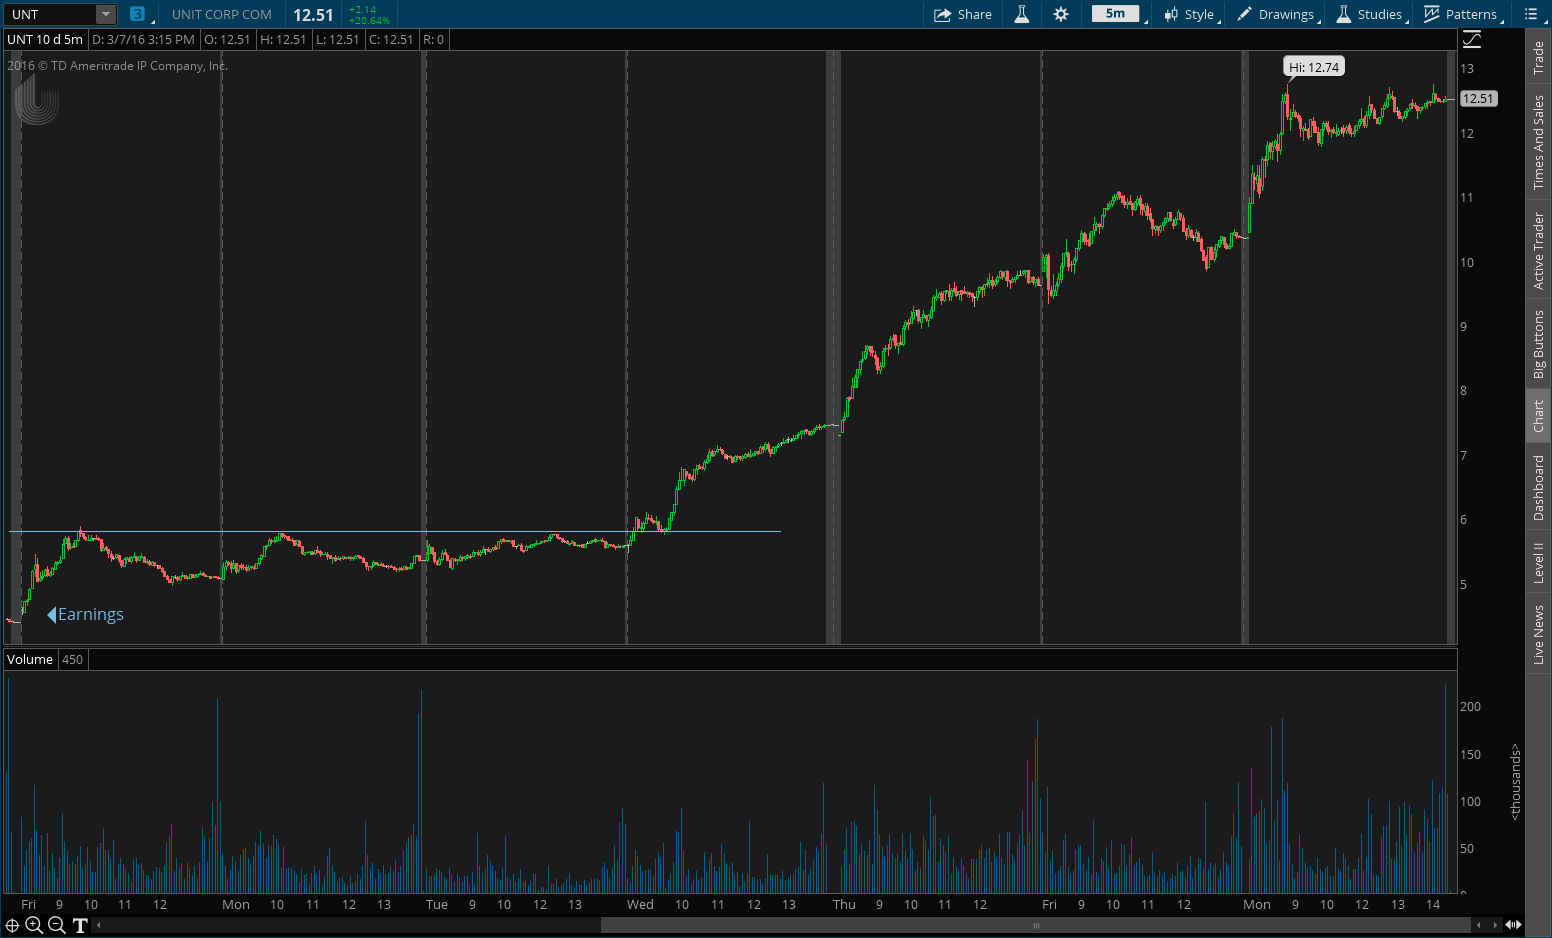
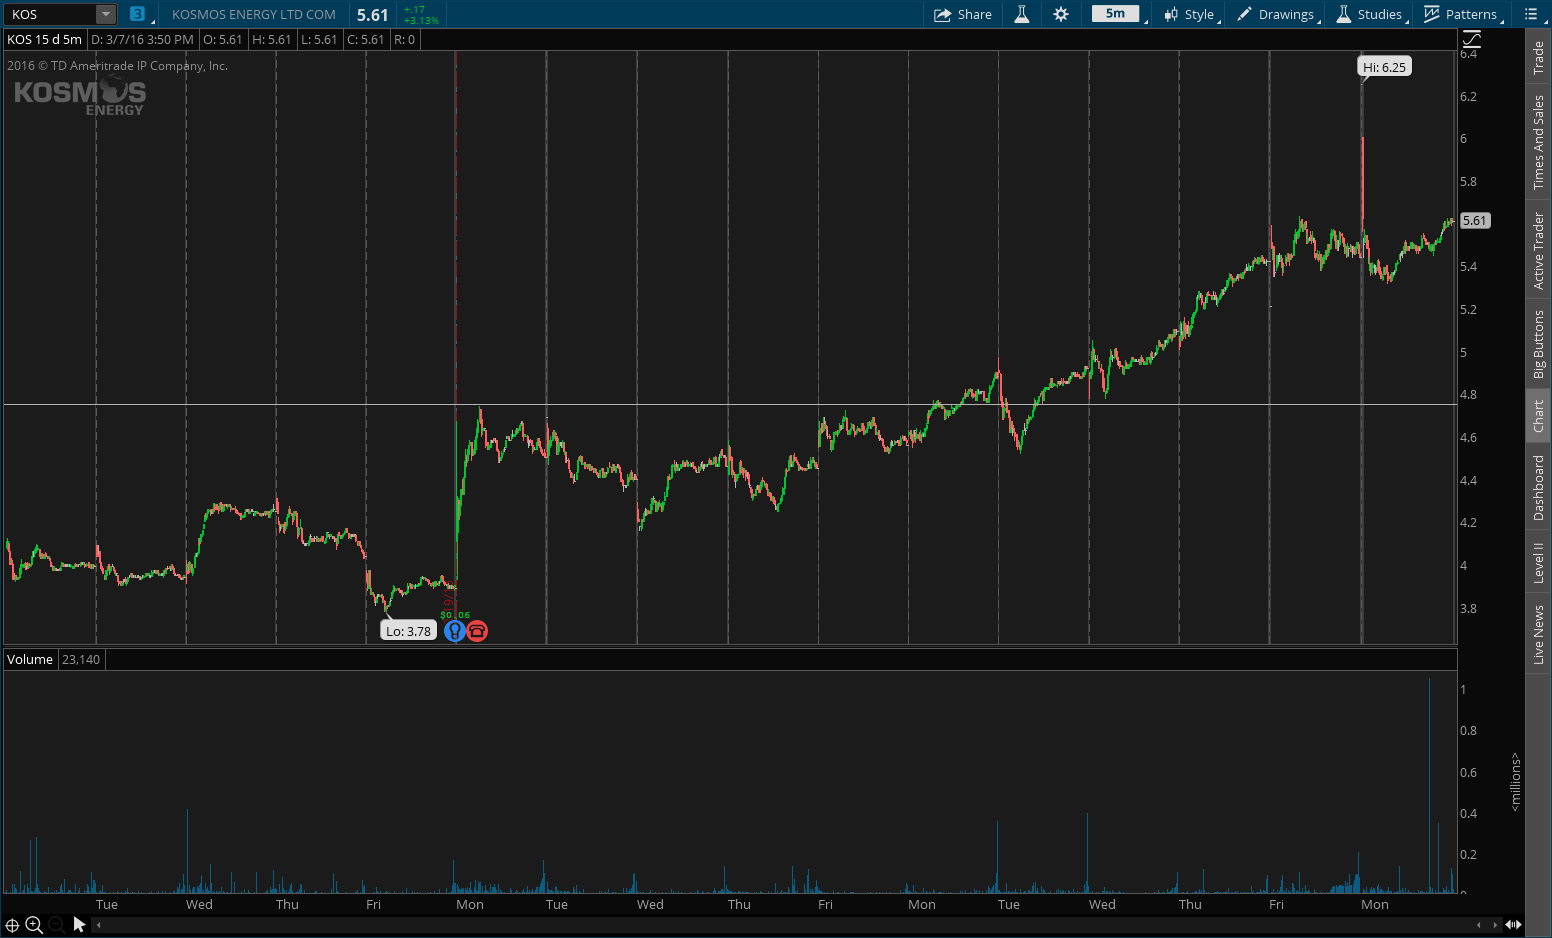
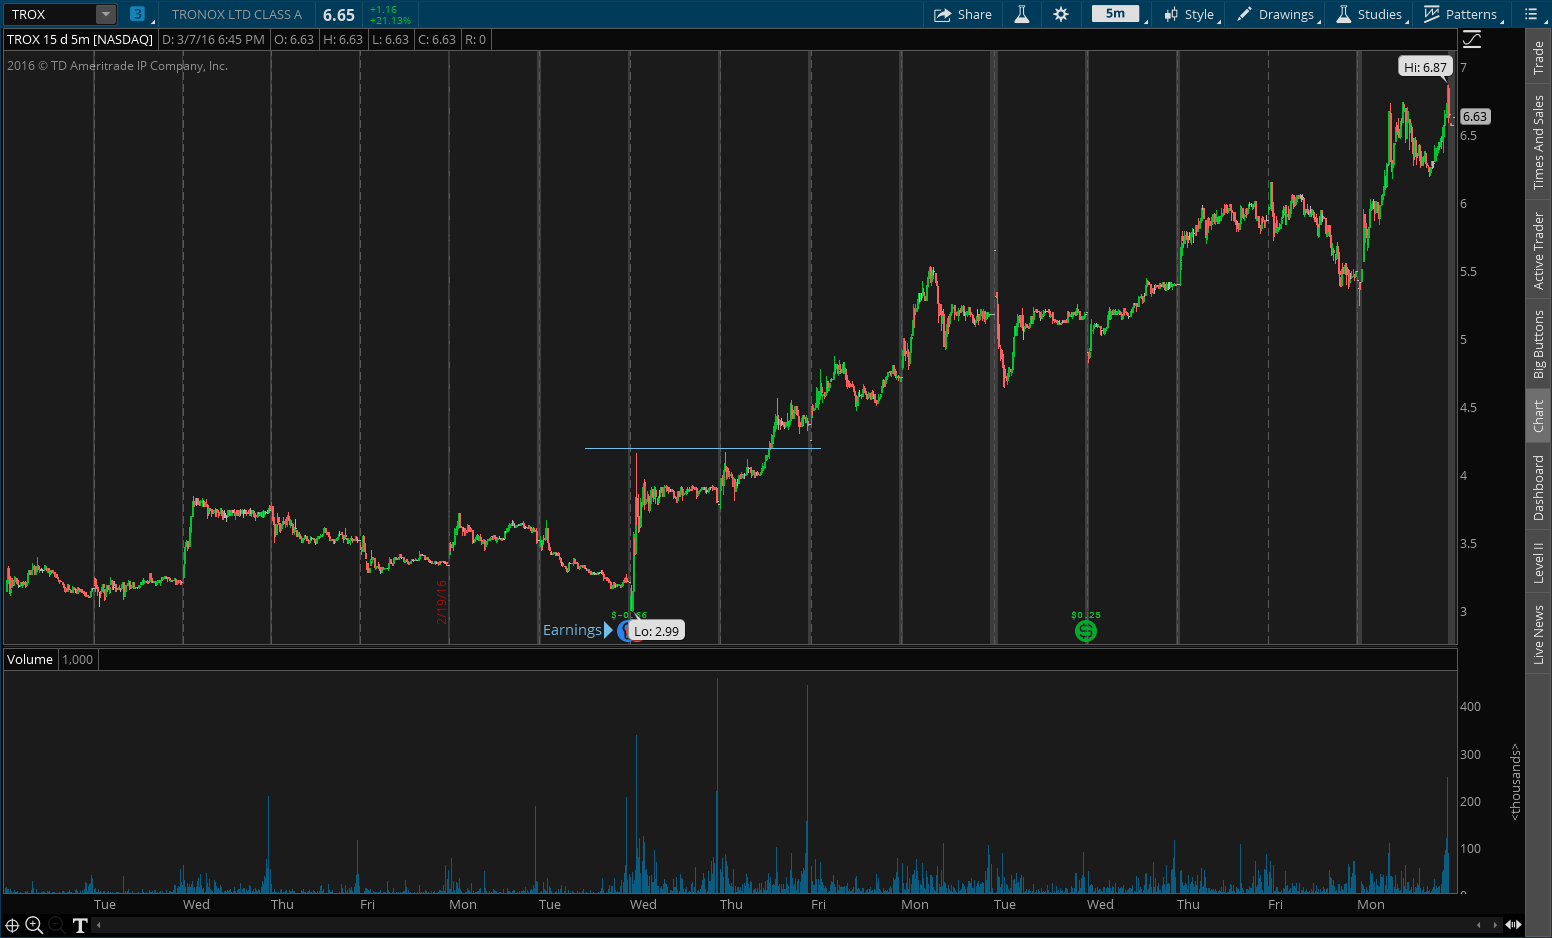
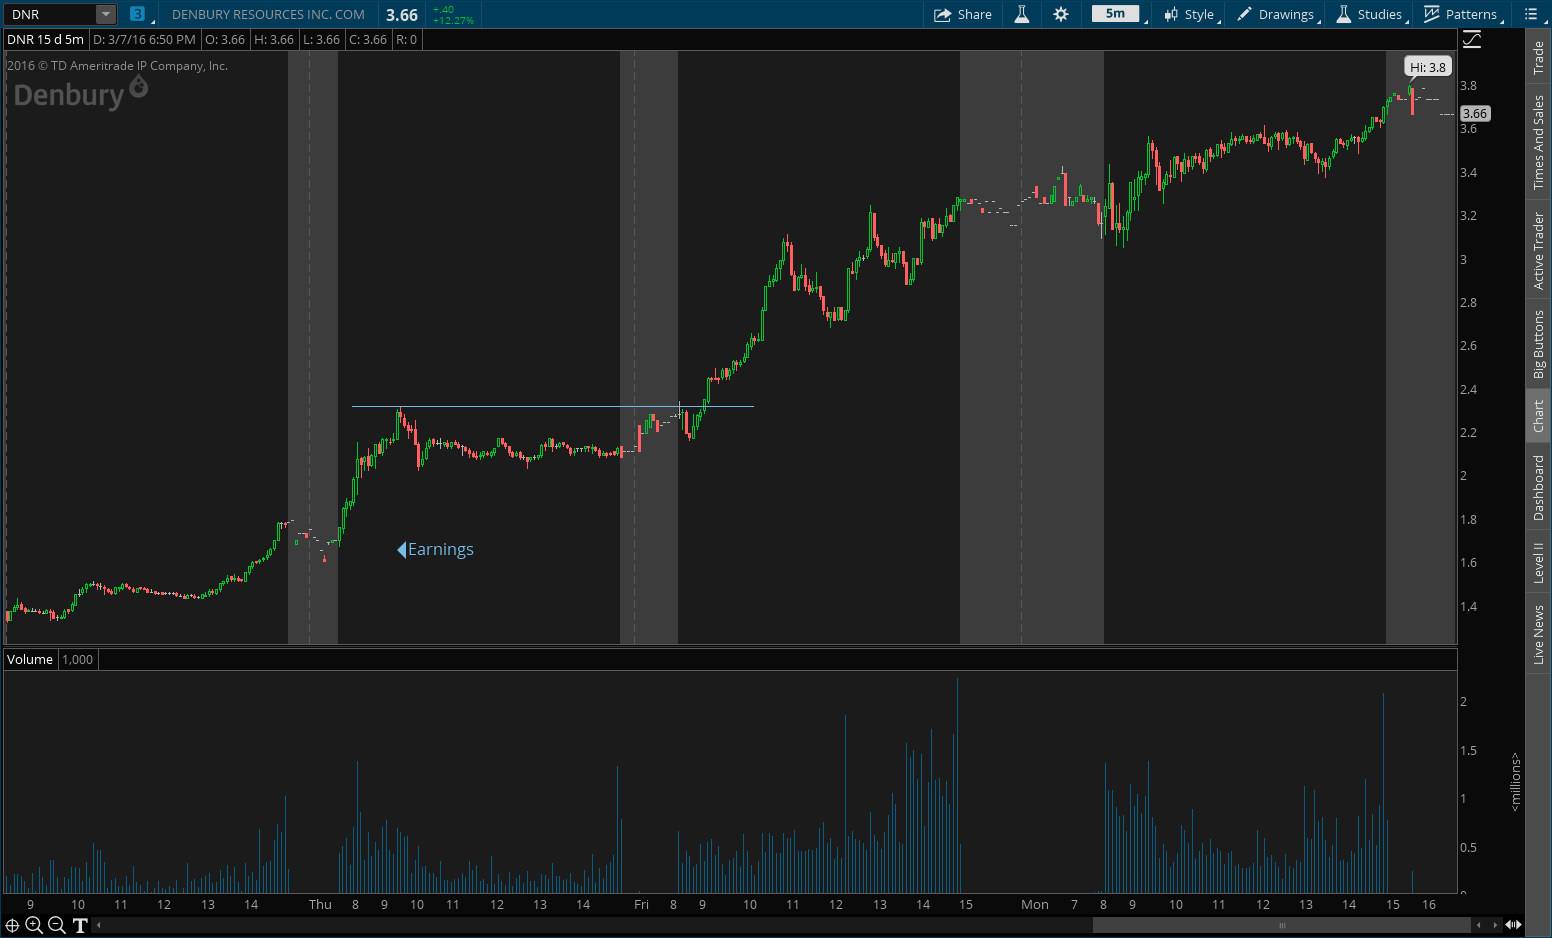
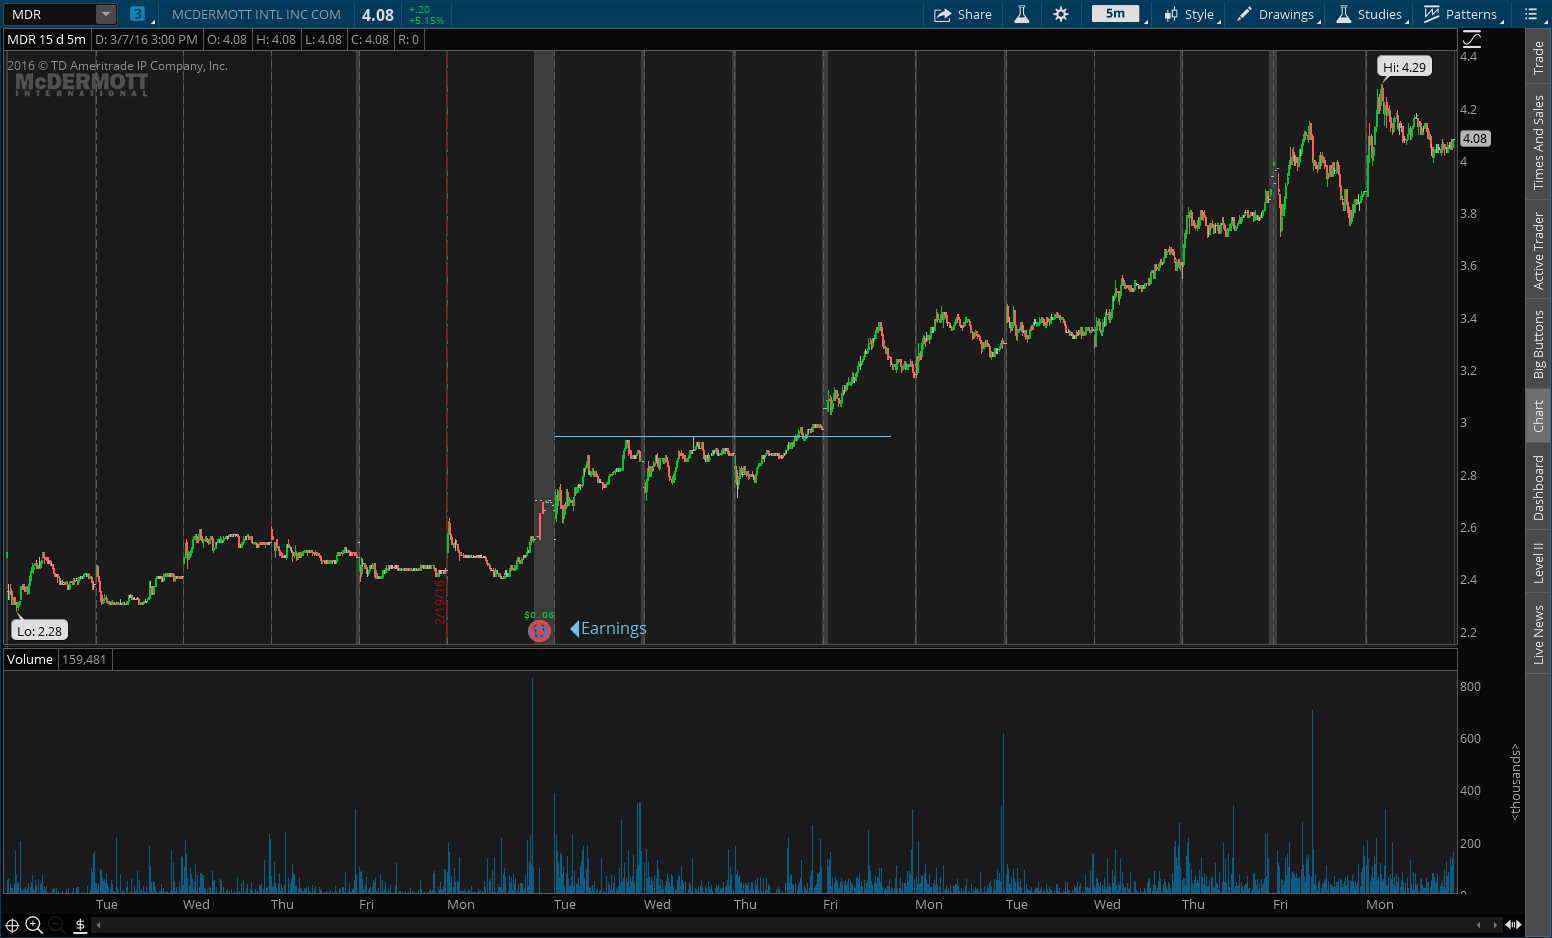
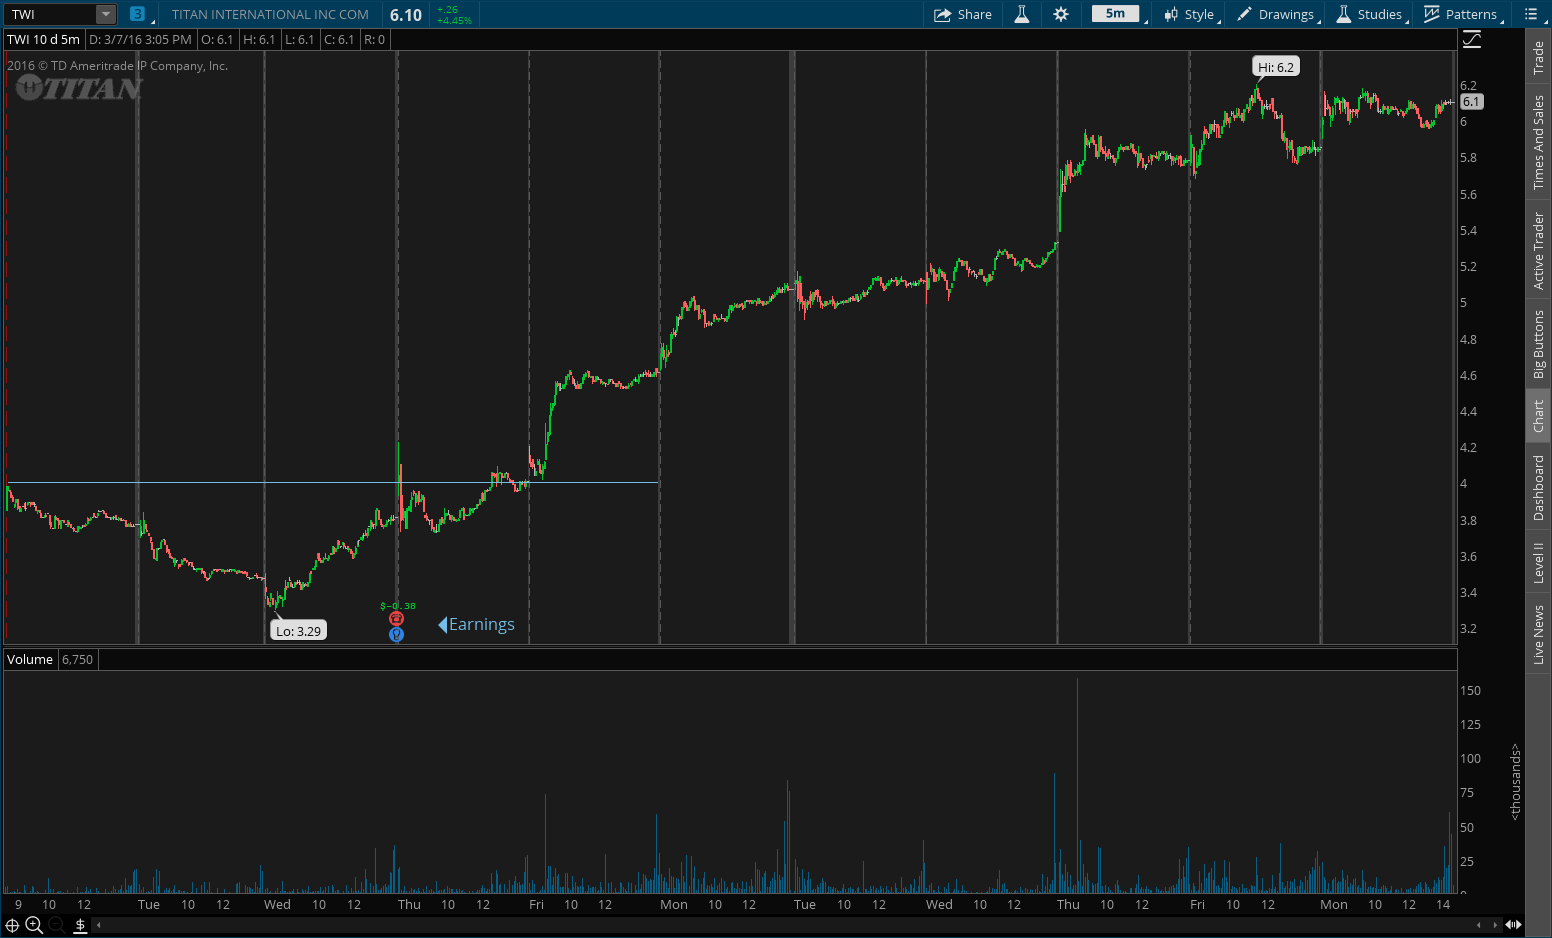
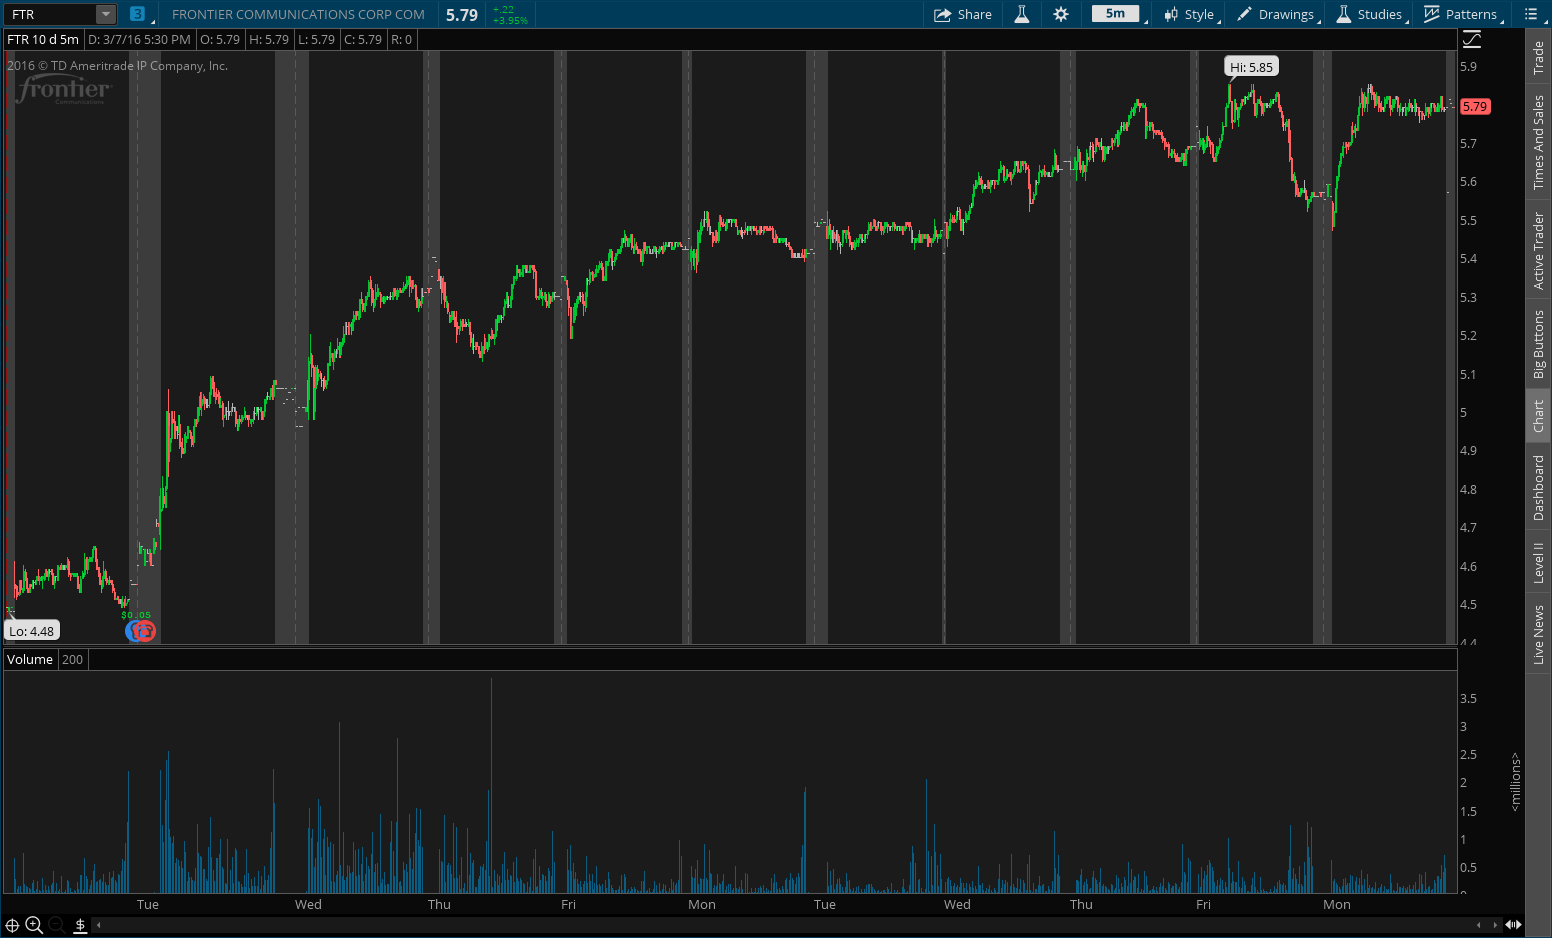
Below you’ll find a bunch of charts from the ThinkorSwim platform. The red icon at the bottom of the chart indicates an earnings conference call, while the blue light bulb represents the earnings event. You’ll notice I’ve drawn a horizontal blue line on some of these charts. This line represents the resistance level on earnings day or post-earnings resistance. We’re looking to buy whenever the price breaks out above that resistance level.
Related Posts

Beginner Stock Trading Tactics for Post-Earnings Momentum
Earnings season is an exciting time for stock traders, as it can lead to…
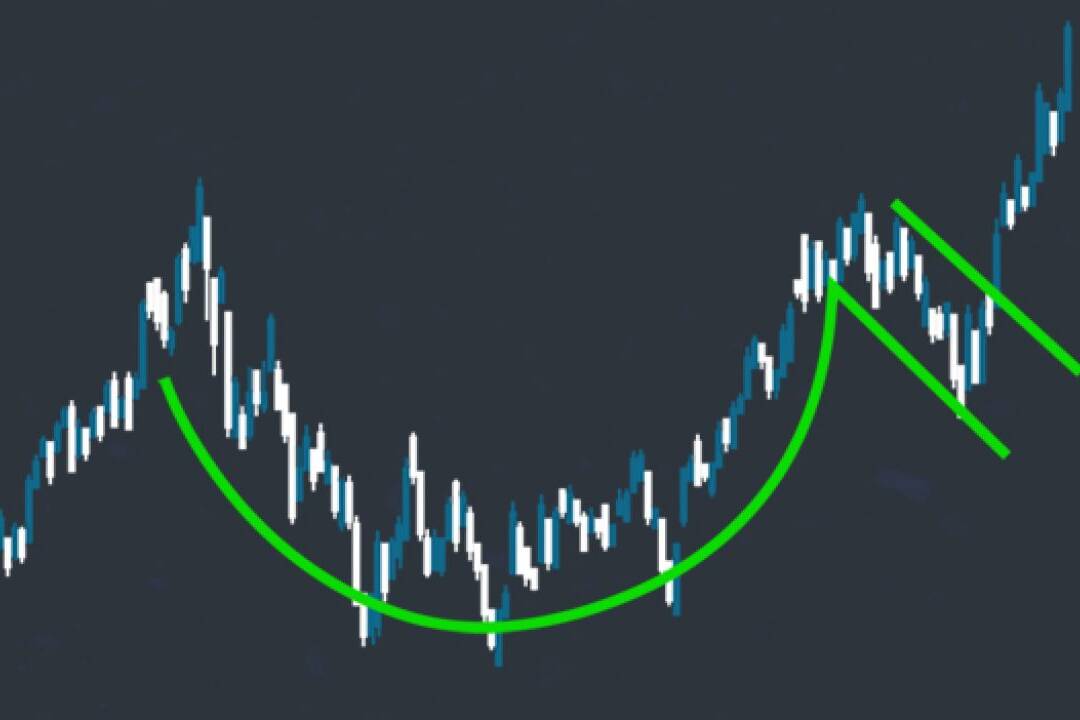
Buying Earnings Winners in Structural Bases: The Cup-with-Handle Approach
Successful stock trading often involves identifying patterns that signal…

Demystifying Earnings Events: A Beginner’s Guide for Entry-Level Traders
Earnings events are significant market occurrences that can greatly impact a…
Great goods from you, man. I have your previous stuff in mind too and you are simply extremely fantastic. I really like what you’ve brought here, really like what you are saying and the way in which you say it. You make it enjoyable and you continue to take care to keep it sensible. I can’t wait to read far more from you. This is actually a tremendous website.